Free Downloads: Online Scientific Graph Plotter
Graph plotter program plots 2D graphs from complex equations.
Graph Plotter program plots 2D graphs from complex equations. The application comprises algebraic, trigonometric, hyperbolic and transcendental functions. EqPlot can be used to verify the results of nonlinear regression analysis program. Graphically Review Equations:Equation Graph Plotter gives engineers and researchers the power to graphically review equations, by...
Category: Home & Education / Mathematics
Publisher: Institute of Mathematics and Statistics, License: Shareware, Price: USD $15.00, File Size: 1.9 MB
Platform: Windows
EzCalc Pro just may be the most feature rich Scientific calculator you have ever seen! Mind boggling capabilities with Integrated Spreadsheet and 3D Plotter! The features in EzCalc Pro for Windows include Brackets, Scientific Functions (Trigonometric, Hyperbolic, Logarithmic - including Base 10, Base 2 & Natural), Memory Function, Paper Trail, 3D Plotter, Unit...
Category: Utilities
Publisher: NativeWinds, License: Shareware, Price: USD $19.95, File Size: 1018.6 KB
Platform: Windows
MathCalc run with the calculator and graph plotter mode.
MathCalc run with the calculator and Graph Plotter mode. Within the calculator mode, you can compute mathematical expressions, trigonometric, hyperbolic or logarithmic functions. The entered expressions and functions are saved into formula lists. The program has a handy, easy-to-use formula editor for these lists. Within the Plotter mode, you can plot 2D graphs a few ways:...
Category: Business & Finance / Calculators
Publisher: YPS software, License: Shareware, Price: USD $24.00, File Size: 1.0 MB
Platform: Windows
RJS Graph produces professional scientific and mathematical graphs.
RJS Graph produces professional Scientific and mathematical graphs. You may study the data with a wide range of data analysis tools. Features include the ability to plot data and equations, fit best fit curves and splines, and display fitted best fit curve parameters. Data can be pasted from a spreadsheet or imported from a text file using a wizard.
Category: Home & Education / Mathematics
Publisher: RJS, License: Freeware, Price: USD $0.00, File Size: 3.7 MB
Platform: Windows
NoPlotter views HP plotter files on any PC monitor or print it on any Windows compatible printer.
NoPlotter views HP Plotter files on any PC monitor or print it on any Windows compatible printer. The output can be scaled up or down and will be in colour on colour printers, and can plot on multiple sheets e.g. to plot A3 on A4 paper.
Main features:
- To print a Plotter file on a Windows compatible printer on multiple pages.
-To view a Plotter file on a...
Category: Internet / Communications
Publisher: Handscomb Consultants Ltd, License: Shareware, Price: USD $0.00, File Size: 0
Platform: Windows
LiveGraph is a framework for real-time data visualisation, analysis and logging. Distinctive features: - A real-time Plotter that can automatically update graphs of your data while it is still being computed by your application. - Concise and simple point-and-click interface that allows to quickly select and compare data series even in applications that output over 1000...
Category: Home & Education / Science
Publisher: LiveGraph open-source project, License: Freeware, Price: USD $0.00, File Size: 889.0 KB
Platform: Windows, Mac, Linux
DF Plotter can determine and display the direction of any transmission using a simple passive antenna switch. This allows voice transmissions from aircraft or other similar radio signals transmissions to be located and displayed on a chart. DF Plotter displays the direction of a radio transmission picked up by your receiver.DF Plotter can drive a passive antenna switch and...
Category: Home & Education / Science
Publisher: Centro de ObservaA§ALo AstronAlmica no Algarve, License: Shareware, Price: USD $0.00, File Size: 0
Platform: Windows
The Cutting Plotter Controller is a software program that lets you perform settings at your computer instead of having to make them at the Plotter's control panel. In particular, frequently-used cutting condition settings and complicated registration mark reading procedures can be easily performed. Using the Controller together with the driver further improves overall...
Category: Utilities / Misc. Utilities
Publisher: Graphtec Corporation, License: Freeware, Price: USD $0.00, File Size: 3.4 MB
Platform: Windows
a powerful, easy-to-use, equation Plotter with numerical and calculus features: - Graph Cartesian functions, relations, and inequalities, plus polar, parametric, and ordinary differential equations. - Up to 999 graphs on screen at once. - New data plotting and curve-fitting features. - Numerically solve and graphically display tangent lines and integrals. - Find critical points,...
Category: Home & Education / Miscellaneous
Publisher: kSoft, Inc., License: Shareware, Price: USD $25.00, File Size: 374.0 KB
Platform: Windows
ImageDIG consists of three integrated modules which allow the user to convert 2D flat images into 3D (x,y,z) data or if a Graph, convert the Graph in image form into 2 dimensional numerical data. The third module is a full analysis plotting utility where the user can import either the 2D or 3D data saved above or import any number of columns of data from a file. The data can then...
Category: Business & Finance / Applications
Publisher: SciCepts Engineering, License: Shareware, Price: USD $49.95, File Size: 0
Platform: Windows
Scientific calculator and function plotter.
Scientific calculator and function Plotter. 10 constant memories, 1cumulating memory. Nearly unlimited nesting of parenthesis. Automatic bracket completion Decimal, hexadecimal and binary entering and display. Precision adjustable.Recall of expressions already calculated. Registers preserved afterprogram termination. Logic operators (32 bit). Three angle units.Square, reciprocal,...
Category: Home & Education / Mathematics
Publisher: Dirk Billand, License: Shareware, Price: USD $15.00, File Size: 1.1 MB
Platform: Windows
 Shareware
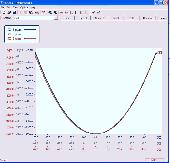
Infinitiscope is a graphical display tool that has special characteristics for numerical data display. It was essentially developed to be used in Scientific research as an accurate and rich tool for creating graphs of numerical data. Even that it was made for Scientific research purposes it is also a general interest powerful numerical analysis tool that connects to many popular...
Category: Business & Finance / Applications
Publisher: SEAAI, License: Shareware, Price: USD $120.00, File Size: 3.3 MB
Platform: Windows
With The Option Strategy Builder you could pick up an option and place it directly to the return Graph. As with the Online tool, just drag and drop the option on the Graph, and build your strategy. Using your mouse, the options can be easily moved on the Graph to different strike prices, and to different expiration dates.
With this program you can manage your...
Category: Multimedia & Design / Multimedia App's
Publisher: SamoaSky, License: Freeware, Price: USD $0.00, File Size: 3.1 MB
Platform: Windows
QuillEdit is an enhanced notepad (maybe wordpad also) replacement.
QuillEdit is an enhanced notepad (maybe wordpad also) replacement. It includes all the features in notepad plus Math equation editor, Symbolic calculator, Graph Plotter, FirEdit syntax highlighter, spelling checker, word counter, and MDI interfaces.
Category: Utilities / Misc. Utilities
Publisher: freewebtown.com, License: Freeware, Price: USD $0.00, File Size: 4.6 MB
Platform: Windows, Mac, 2K, 2K3
Create your own custom sheets of Graph paper. You have complete control over the Graph characteristics. X and Y axis can independently be set for linear or log scale. Selection from a dozen standard paper sizes, or custom create your own. Graphs saved as pdf files you can print them whenever you wish. Choose whatever color you want for the lines. Specify independent line weights...
Category: Home & Education
Publisher: Black Cat Systems, License: Shareware, Price: USD $19.99, File Size: 1.4 MB
Platform: Windows
Memory connected spreadsheet, Plotter and 2D grid-style display: spreadsheet functionality and information display is critical when working with data but multi-dimensional relationships are also important. The Plotter provides the ability to plot one channel (function) versus any other in the file or versus record number but the application allows the user to naturally split their...
Category: Utilities / Misc. Utilities
Publisher: PetRos Eikon Inc., License: Shareware, Price: USD $200.00, File Size: 48.4 MB
Platform: Windows
Graph Studio is the open source graph drawing/processing software.
Graph Studio is the open source Graph drawing/processing software. It allows users to build and process highly customizable graphs.
Category: Multimedia & Design
Publisher: sourceforge.net, License: Freeware, Price: USD $0.00, File Size: 118.0 KB
Platform: Windows, Mac, Vista
Scientific-oriented Python Distribution based on Qt and Spyder.
Scientific-oriented Python Distribution based on Qt and Spyder. It is a mayaVi 2 powerful 2D and 3D Scientific visualization tool. Free Scientific and engineering development software for numerical computations, data analysis and data visualization based on Python programming language.
Category: Software Development / Misc. Programming
Publisher: pythonxy, License: Freeware, Price: USD $0.00, File Size: 39.4 MB
Platform: Windows
Genius Maker contains 32 educational softwares covering the subjects Mathematics, Physics and Chemistry for High school students. It includes Graph Plotter, Analytical geometry, Matrix algebra, Equation solver, Triangle solver, Unit converter, Refraction of rays, Lens and mirrors, Color theory, Transverse waves, Radioactive decay, Periodic table, Gas Laws etc. Out of the 32...
Category: Home & Education / Science
Publisher: Golden K star Private Ltd, License: Freeware, Price: USD $0.00, File Size: 3.4 MB
Platform: Windows
Rt-Plot is a tool to generate Cartesian X/Y-plots from scientific data.
Rt-Plot is a tool to generate Cartesian X/Y-plots from Scientific data. You can enter and calculate tabular data. View the changing graphs, including linear and non linear regression, interpolation, differentiation and integration, during entering. Rt-Plot enables you to create plots fast and easily. The line calculations give full access to calculation and display ranges and can use...
Category: Home & Education / Mathematics
Publisher: Rt-Science, License: Shareware, Price: USD $29.90, File Size: 5.2 MB
Platform: Windows
Chart java applet software to generate dynamic charts and graphs - bar, line, pie, stacked and grouped charts in 2D and 3D with a wide range of parameters and chart types. Main features: Charts in 2D/3D, Anti aliasing, Multi language support, Cross browser compatible, Java Script parameter control, Data labels, Contextual data drill down, CSV data sources, Trend calculation, 3D depth control,...
Category: Software Development / Tools & Editors
Publisher: Swiftchart Limited, License: Demo, Price: USD $99.00, File Size: 97.0 KB
Platform: Windows, Mac, Linux, Unix, MS-DOS, AS, 400
CR80E - Scientific calculator for Windows.
CR80E - Scientific calculator for Windows. 123 functionalities.
Date, normal and binomial distribution calculations.
Mean and ratio confidence interval estimation.
Determinant, combinatory, lcm, gcm.
User's Manual in PDF format.
Category: Business & Finance / Calculators
Publisher: Vaxa Software, License: Shareware, Price: USD $9.00, File Size: 2.1 MB
Platform: Windows

Chart java applet software to generate dynamic charts and graphs - bar, line, pie, stacked and grouped charts in 2D and 3D with a wide range of parameters and chart types. Main features: Charts in 2D/3D, Anti aliasing, Multi language support, Cross browser compatible, Java Script parameter control, Data labels, Contextual data drill down, CSV data sources, Trend calculation, 3D depth control,...
Category: Multimedia & Design
Publisher: Swiftchart Limited, License: Demo, Price: USD $99.00, File Size: 97.7 KB
Platform: Windows, Mac, Linux, Unix, MS-DOS, AS/400
DreamCalc is the leading Scientific Graphing Calculator for Windows that's so realistic it dispenses with the need for a physical hand-held altogether!
- It Feels Real! Get the intuitive feel and productivity of a real calculator. No more hunting around for your hand-held!
- Graph functions & plot data in seconds.
Category: Business & Finance / Calculators
Publisher: Big Angry Dog Ltd, License: Shareware, Price: USD $15.99, File Size: 4.2 MB
Platform: Windows
Ping Plotter is a fast, small, and visual Ping/Trace Route utility that uses multiple threads to trace all hops at once for SUBSTANTIAL performance improvements over standard trace routes. Delivers visual graphs of performance to pinpoint problems and see ranges of responses and trends. Will trace continuously with any interval. Show your ISP where their problems are - so they can fix...
Category: Internet / Tools & Utilities
Publisher: Nessoft, LLC, License: Freeware, Price: USD $0.00, File Size: 655.4 KB
Platform: Windows