Free Downloads: Plot Graph Function

Audio Graph ActiveX is an ActiveX (OCX) component for software developers. With this ActiveX component you can display a meter, detect a silence, and display 2 types of audio graphs by the WaveIn/WaveOut buffers. Just send a pointer of the buffers array to the component then operate the Display Function, the component will do the rest on the Graph view. You can set the...
Category: Software Development
Publisher: expresslib.com, License: Shareware, Price: USD $69.00, File Size: 806.5 KB
Platform: Windows
Scientific calculator and function plotter.
Scientific calculator and Function plotter. 10 constant memories, 1cumulating memory. Nearly unlimited nesting of parenthesis. Automatic bracket completion Decimal, hexadecimal and binary entering and display. Precision adjustable.Recall of expressions already calculated. Registers preserved afterprogram termination. Logic operators (32 bit). Three angle units.Square, reciprocal, square...
Category: Home & Education / Mathematics
Publisher: Dirk Billand, License: Shareware, Price: USD $15.00, File Size: 1.1 MB
Platform: Windows

Obtain data from images of graphs scanned from articles or available as image. Import the Graph into ScanIt from a scanner or file, or from the clipboard. Define locations of the Graph's axes by indicating known points. Extract data from the Graph by manually picking points, by scanning for points or by scanning along curves. Copy the scanned data to Excel or export data to...
Category: Home & Education / Science
Publisher: amsterchem, License: Freeware, Price: USD $0.00, File Size: 6.1 MB
Platform: Windows
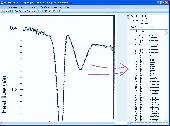
dcsDigitiser, a Graph digitizer and densitometer, converts graphs into digital X-Y numerical numbers for peer analysis of graphs and gel in the open literature and/or of your own hard copies. With excellent performance, dcsDigitiser is accurate, precise, versatile and straightforward in its use. It is now only a few clicks to get a numerical reading of graphs of interest while surfing on...
Category: Home & Education / Mathematics
Publisher: J & C Consultation and Technology, License: Shareware, Price: USD $120.00, File Size: 3.8 MB
Platform: Windows
Create your own custom sheets of Graph paper. You have complete control over the Graph characteristics. X and Y axis can independently be set for linear or log scale. Selection from a dozen standard paper sizes, or custom create your own. Graphs saved as pdf files you can print them whenever you wish. Choose whatever color you want for the lines. Specify independent line weights...
Category: Home & Education
Publisher: Black Cat Systems, License: Shareware, Price: USD $19.99, File Size: 1.4 MB
Platform: Windows
Graph Studio is the open source graph drawing/processing software.
Graph Studio is the open source Graph drawing/processing software. It allows users to build and process highly customizable graphs.
Category: Multimedia & Design
Publisher: sourceforge.net, License: Freeware, Price: USD $0.00, File Size: 118.0 KB
Platform: Windows, Mac, Vista
GraphSight Junior is an easy to use freeware handy 2D math-graphing program.
GraphSight Junior is an easy to use freeware handy 2D math-graphing program. It was originally designed to help students and teachers satisfy their day-after-day math plotting needs. It makes it easy to Plot and explore common Y(X) = F(X) Cartesian graphs, set text labels on the coordinate plane, zoom or shift a Graph with just a single click & move of mouse. The resulting...
Category: Home & Education / Miscellaneous
Publisher: CradleFields.com, License: Freeware, Price: USD $0.00, File Size: 393.0 KB
Platform: Windows
Use Visual Probability to compute and graph PDF, CDF and quantile values of ten more distributions.
Use Visual Probability to compute and Graph probability density Function values, cumulative distribution Function values, quantile values, means and variances of ten more distributions. Use Visual Probability to compute and Graph probability density Function values, cumulative distribution Function values, quantile values, means and variances of ten...
Category: Home & Education / Mathematics
Publisher: GraphNow, License: Shareware, Price: USD $35.00, File Size: 1.8 MB
Platform: Windows
Bytescout Graph Digitizer Scout is a handy and useful application that provides users with several functions. This program allows you to convert hard copy graphs, plots and charts. This efficient software enables you to digitize graphs, charts and plots using automated methods such as luminosity recognition and color recognition. The program works almost automatically, but you can opt to...
Category: Multimedia & Design / Multimedia App's
Publisher: ByteScout, License: Shareware, Price: USD $34.45, File Size: 5.2 MB
Platform: Windows
Chart java applet software to generate dynamic charts and graphs - bar, line, pie, stacked and grouped charts in 2D and 3D with a wide range of parameters and chart types. Main features: Charts in 2D/3D, Anti aliasing, Multi language support, Cross browser compatible, Java Script parameter control, Data labels, Contextual data drill down, CSV data sources, Trend calculation, 3D depth control,...
Category: Software Development / Tools & Editors
Publisher: Swiftchart Limited, License: Demo, Price: USD $99.00, File Size: 97.0 KB
Platform: Windows, Mac, Linux, Unix, MS-DOS, AS, 400

Chart java applet software to generate dynamic charts and graphs - bar, line, pie, stacked and grouped charts in 2D and 3D with a wide range of parameters and chart types. Main features: Charts in 2D/3D, Anti aliasing, Multi language support, Cross browser compatible, Java Script parameter control, Data labels, Contextual data drill down, CSV data sources, Trend calculation, 3D depth control,...
Category: Multimedia & Design
Publisher: Swiftchart Limited, License: Demo, Price: USD $99.00, File Size: 97.7 KB
Platform: Windows, Mac, Linux, Unix, MS-DOS, AS/400
HOBOware data logging software lets you view, Graph and analyze data with point-and-click simplicity. You can easily setup your application in a matter of minutes, quickly readout and Plot data, and export to spreadsheets for further analysis.
Features of HOBOware Pro Data Logging Software:
Presentation quality graphics
Powerful Analysis
Alarm...
Category: Multimedia & Design / Digital Media Editors
Publisher: Onset Computer Corporation, License: Shareware, Price: USD $84.00, File Size: 101.0 MB
Platform: Windows
Calc 3D is a collection of mathematical tools for highschool and university. The calculator can do statistics, best fits, Function plotting, integration. It handles vectors, matrices, complex numbers, coordinates, regular polygons and intersections. For objects ( like point, line, plane and sphere) distances and intersections are calculated. Cartesian, spherical and cylindrical...
Category: Home & Education
Publisher: Greuer Andreas, License: Freeware, Price: USD $0.00, File Size: 4.1 MB
Platform: Windows
The Plot control created to display graphs and charts on .
The Plot control created to display graphs and charts on .NET Windows Forms. Advantages of this control are very quick embedding into your application and powerful features. Written using 100% managed code. Also, this control can be used to create animated graphs. With this control You can: draw lines just from arrays, use gradients to fill lines colors, draw histograms just by passing...
Category: Software Development / Components & Libraries
Publisher: Advanced Software Solutions, License: Shareware, Price: USD $19.00, File Size: 1.1 MB
Platform: Windows
If you are searching for a computer program that can Plot simple graphs on your PC, GraphSight Junior is what you are looking for. This utility is feature rich and comprehensive. It plots 2D graphs with easy navigation, and it’s well suited for high school and college math students.
It can Plot Cartesian, polar, table defined, as well as specialty graphs, such as...
Category: Home & Education / Mathematics
Publisher: CradleFields.com, License: Freeware, Price: USD $0.00, File Size: 417.5 KB
Platform: Windows
Graph constructs, visualizes and modifies graphs as well as calculates measures and layouts.
Graph constructs, visualizes and modifies graphs as well as calculates measures and layouts.
CoSBiLab Graph can construct, visualize and modify graphs as well as calculate measures and layouts. CoSBiLab Graph can import and export data in a variety of formats, among which the reaction network generated by the beta WorkBench.
Category: Multimedia & Design / Multimedia App's
Publisher: CoSBi, License: Freeware, Price: USD $0.00, File Size: 3.1 MB
Platform: Windows
Complex Grapher is a graphing calculator to create a Graph of complex Function. 3D Function graphs and 2D color maps can be created with this grapher. You can input complex functions in the form of w=f(z) (where z=x+yi) directly before creacting graphs. Graphs can be copied and saved in the format of bitmap.Complex Grapher is a graphing calculator to create a Graph...
Category: Home & Education
Publisher: GraphNow, License: Shareware, Price: USD $19.95, File Size: 976.6 KB
Platform: Windows
The primary purpose of XL-Plot is to create a figure rapidly.
The primary purpose of XL-Plot is to create a figure rapidly. It is ideal for for use at high school, as the path from data in one or more spreadsheet columns to the final figure is short (just a few mouse clicks) and easy to grasp. It contains basic stat
Category: Home & Education / Mathematics
Publisher: bram.org, License: Freeware, Price: USD $0.00, File Size: 2.0 MB
Platform: Windows

Chart java applet software to generate dynamic charts and graphs within JSP, servlets or java applications - bar, line, pie, stacked and grouped charts in 2D and 3D with a wide range of parameters and chart types. Main features: Charts in 2D/3D, Anti aliasing, Multi language support, Cross browser compatible, Java Script parameter control, Data labels, Contextual data drill down, CSV data...
Category: Software Development
Publisher: Swiftchart Limited, License: Demo, Price: USD $99.00, File Size: 97.7 KB
Platform: Windows, Mac, Linux, Unix, MS-DOS, AS/400
Chart java applet software to generate dynamic charts and graphs within JSP, servlets or java applications - bar, line, pie, stacked and grouped charts in 2D and 3D with a wide range of parameters and chart types. Main features: Charts in 2D/3D, Anti aliasing, Multi language support, Cross browser compatible, Java Script parameter control, Data labels, Contextual data drill down, CSV data...
Category: Software Development / Tools & Editors
Publisher: Swiftchart Limited, License: Demo, Price: USD $99.00, File Size: 97.0 KB
Platform: Windows, Mac, Linux, Unix, MS-DOS, AS, 400
MathCalc run with the calculator and graph plotter mode.
MathCalc run with the calculator and Graph plotter mode. Within the calculator mode, you can compute mathematical expressions, trigonometric, hyperbolic or logarithmic functions. The entered expressions and functions are saved into formula lists. The program has a handy, easy-to-use formula editor for these lists. Within the plotter mode, you can Plot 2D graphs a few ways: using...
Category: Business & Finance / Calculators
Publisher: YPS software, License: Shareware, Price: USD $24.00, File Size: 1.0 MB
Platform: Windows
Are you tired of printing drawings? well! we have a solution for you. What is plot2k? plot2k is AutoCAD Batch Plot Utility which can open and print AutoCAD drawings in Batch mode. Plot2k is a 32 bit utility designed to open and print AutoCAD drawings in batch mode. with batch Plot drawings you can print either all of your drawings or selected drawings in one go. Plot2k is featured...
Category: Multimedia & Design
Publisher: PLot2k, License: Shareware, Price: USD $39.95, File Size: 968.0 KB
Platform: Windows
DataPlot is a program where you can import your time based data and graph it.
DataPlot is a program where you can import your time based data and Graph it.You can move easily back and forward in user defined time window, allows individual time setting for each Graph, values read directly in Graph by dragging mouse over the curve and much more
Category: Multimedia & Design / Multimedia App's
Publisher: CBIM, License: Freeware, Price: USD $0.00, File Size: 311.0 KB
Platform: Windows
Drawing graphs without the right tool is simply difficult.
Drawing graphs without the right tool is simply difficult. uDraw(Graph) automates this task for you. Find out how uDraw(Graph) creates your flow charts, diagrams, hierarchies or structure visualizations using automatic layout - much faster than with any standard drawing program. With the API, uDraw(Graph) can even be embedded in your own programs as a visualization component.
Category: Multimedia & Design / Image Editing
Publisher: University Bremen, FB3, Germany, License: Freeware, Price: USD $0.00, File Size: 2.6 MB
Platform: Windows
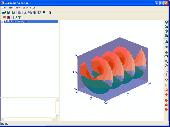
Math tool for high school teachers and students. Function graphing and analyzing: 2D, 2.5D Function graphs and animations, extrema, root, tangent, limit,derivative, integral, inverse; sequence of number: arithmetic progression, geometric progression; analytic geometry: vector, line, circle, ellipse, hyperbola and parabola; solid geometry: spatial line, prism, pyramid, cylinder,...
Category: Home & Education / Mathematics
Publisher: GraphNow, License: Shareware, Price: USD $29.95, File Size: 2.3 MB
Platform: Unknown