Free Downloads: Plot Stock Trades In Excell Graph
TickerLog software can be used to keep a journal of stock trades in your own PC.
TickerLog software can be used to keep a journal of Stock Trades in your own PC. It presents completed Trades and open positions in easy to use, color coded table format which can be used to review and analyze past Trades effectively. The software is very intuitive and provides valuable summary information such as profits, wins, losses, expectancy, trends etc., Using...
Category: Business & Finance / Personal Finance
Publisher: KS&G, License: Shareware, Price: USD $14.95, File Size: 819.2 KB
Platform: Windows
Excel Graph Multiple Equations Software is an application that allows you to Plot multiple functions in Microsoft Excel. It is able to create multiple charts based on the formulas entered. You can enter an equation manually or load multiple equations from a text file (.txt). The application is able to Plot each equation on an individual Graph or all the equations on...
Category: Business & Finance / MS Office Addons
Publisher: Sobolsoft, License: Shareware, Price: USD $19.99, File Size: 2.5 MB
Platform: Windows
StockTick 2005 is a free Stock market ticker and portfolio manager to securely track your stocks and Trades. Real time and international quotes included in Stock ticker. See why people are saying it is the best Stock quote portfolio tracking software program on the market for the past 9 Years! Full featured with no limitations. Use as long as you like. Register to...
Category: Business & Finance / Applications
Publisher: IndigoWind, License: Shareware, Price: USD $24.95, File Size: 1.2 MB
Platform: Windows
Chart java applet software to generate dynamic charts and graphs - bar, line, pie, stacked and grouped charts in 2D and 3D with a wide range of parameters and chart types. Main features: Charts in 2D/3D, Anti aliasing, Multi language support, Cross browser compatible, Java Script parameter control, Data labels, Contextual data drill down, CSV data sources, Trend calculation, 3D depth control,...
Category: Software Development / Tools & Editors
Publisher: Swiftchart Limited, License: Demo, Price: USD $99.00, File Size: 97.0 KB
Platform: Windows, Mac, Linux, Unix, MS-DOS, AS, 400

Chart java applet software to generate dynamic charts and graphs - bar, line, pie, stacked and grouped charts in 2D and 3D with a wide range of parameters and chart types. Main features: Charts in 2D/3D, Anti aliasing, Multi language support, Cross browser compatible, Java Script parameter control, Data labels, Contextual data drill down, CSV data sources, Trend calculation, 3D depth control,...
Category: Multimedia & Design
Publisher: Swiftchart Limited, License: Demo, Price: USD $99.00, File Size: 97.7 KB
Platform: Windows, Mac, Linux, Unix, MS-DOS, AS/400
MathTrax is a graphing tool for middle school and high school students to Graph equations, physics simulations or Plot data files.
The graphs have descriptions and sound so you can hear and read about the Graph. Blind and low vision users can access visual math data and Graph or experiment with equations and datasets.
Category: Business & Finance / Applications
Publisher: The MathTrax Team, License: Freeware, Price: USD $0.00, File Size: 21.0 MB
Platform: Windows
Chart java applet software to generate dynamic charts and graphs within JSP, servlets or java applications - bar, line, pie, stacked and grouped charts in 2D and 3D with a wide range of parameters and chart types. Main features: Charts in 2D/3D, Anti aliasing, Multi language support, Cross browser compatible, Java Script parameter control, Data labels, Contextual data drill down, CSV data...
Category: Software Development / Tools & Editors
Publisher: Swiftchart Limited, License: Demo, Price: USD $99.00, File Size: 97.0 KB
Platform: Windows, Mac, Linux, Unix, MS-DOS, AS, 400

Chart java applet software to generate dynamic charts and graphs within JSP, servlets or java applications - bar, line, pie, stacked and grouped charts in 2D and 3D with a wide range of parameters and chart types. Main features: Charts in 2D/3D, Anti aliasing, Multi language support, Cross browser compatible, Java Script parameter control, Data labels, Contextual data drill down, CSV data...
Category: Software Development
Publisher: Swiftchart Limited, License: Demo, Price: USD $99.00, File Size: 97.7 KB
Platform: Windows, Mac, Linux, Unix, MS-DOS, AS/400
Plot Digitizer is a great piece of software developed by Joseph A.
Plot Digitizer is a great piece of software developed by Joseph A. Huwaldt. The main goal of the program is to extract information from two-dimensional plots or graphs. It is very common to find information the form of a Plot or Graph, showing the relation between two variables. However, this information will not be useful until data is converted to standard x-y values...
Category: Multimedia & Design / Multimedia App's
Publisher: Joseph A. Huwaldt, License: Freeware, Price: USD $0.00, File Size: 4.4 MB
Platform: Windows
GStock is a supercomputer for stock picks and signals. Its supercomputing power is dedicated to consistently point to profitable trades with a high degree of certainty.
Category: Business & Finance
Publisher: GridStock Ltd, License: Freeware, Price: USD $0.00, File Size: 381.9 KB
Platform: Windows
FREE Quote Watchlist Software for over 50 exchanges worldwide. Keep track of your Trades with this easy to use quote watchlist tool, data feeds are free so you can monitor your Trades with zero cost. Quick Quote enables you to monitor your trading/investment portfolio with auto-refresh capabilities, this leaves you in better control as you are constantly updated with your...
Category: Business & Finance
Publisher: Anfield Capital Pty Ltd, License: Freeware, Price: USD $0.00, File Size: 2.6 MB
Platform: Windows
Function Grapher is an easy-to-use software to create 2D, 2.5D, 3D function graphs, animations and table graphs. 2D Features: explicit, implicit, parametric, and in equation; Cartesian and polar coordinate systems; curve and animation; Graph of inverse function and derivative function; parity; maximum, minimum, and inflexion; integration; root; the length of curve; tangent and normal;...
Category: Home & Education / Mathematics
Publisher: GraphNow, License: Shareware, Price: USD $39.95, File Size: 2.9 MB
Platform: Unknown
LiveGraph is a framework for real-time data visualisation, analysis and logging. Distinctive features: - A real-time plotter that can automatically update graphs of your data while it is still being computed by your application. - Concise and simple point-and-click interface that allows to quickly select and compare data series even in applications that output over 1000 series...
Category: Home & Education / Science
Publisher: LiveGraph open-source project, License: Freeware, Price: USD $0.00, File Size: 889.0 KB
Platform: Windows, Mac, Linux
With this platform, you can offer your clients the best trading terminal and better services, thus enabling them to execute Trades in several financial markets and Stock exchanges in one account.
MetaTrader 5 is the trading platform designed to arrange brokerage services in Forex, CFD, Futures, as well as equity markets.
Category: Business & Finance / Business Finance
Publisher: MetaQuotes Software Corp., License: Freeware, Price: USD $0.00, File Size: 450.7 KB
Platform: Windows
MatheGrafix is an excellent tool that allows you to Plot 2D graphs including linear, geometric, exponential, fractals ones and more. The program operates in two modes: you can introduce the formula and Plot the Graph or you can draw interactively a geometric function on the Graph.
There are two important windows: the "Mode functions" window...
Category: Business & Finance / Applications
Publisher: Roland Hammes, License: Freeware, Price: USD $0.00, File Size: 1.8 MB
Platform: Windows
PSI-Plot brings flexibility to technical plotting and data analysis.
PSI-Plot brings flexibility to technical plotting and data analysis. It has a powerful scientific spreadsheet for data analysis, and an object-oriented on screen graphics editor that makes it easy to design and modify graphs. The powerful features combine with the intuitive and user friendly interface have made PSI-Plot one of the most popular data analysis and graphing program....
Category: Multimedia & Design / Multimedia App's
Publisher: Poly Software International, Inc., License: Shareware, Price: USD $0.00, File Size: 0
Platform: Windows
Rt-Plot is a tool to generate Cartesian X/Y-plots from scientific data.
Rt-Plot is a tool to generate Cartesian X/Y-plots from scientific data. You can enter and calculate tabular data. View the changing graphs, including linear and non linear regression, interpolation, differentiation and integration, during entering. Rt-Plot enables you to create plots fast and easily. The line calculations give full access to calculation and display ranges and can...
Category: Home & Education / Mathematics
Publisher: Rt-Science, License: Shareware, Price: USD $29.90, File Size: 5.2 MB
Platform: Windows
RJS Graph produces professional scientific and mathematical graphs.
RJS Graph produces professional scientific and mathematical graphs. You may study the data with a wide range of data analysis tools. Features include the ability to Plot data and equations, fit best fit curves and splines, and display fitted best fit curve parameters. Data can be pasted from a spreadsheet or imported from a text file using a wizard.
Category: Home & Education / Mathematics
Publisher: RJS, License: Freeware, Price: USD $0.00, File Size: 3.7 MB
Platform: Windows
Visually build your story as your ideas come to you.
Visually build your story as your ideas come to you. Strategically place novel chapters, screenplay scenes and subplots on a three act excitement Graph to construct your story. There are no constraints of a structured formula. Just use the excitement Graph to guide your scene assembly as you write your story in standard format.
Category: Multimedia & Design / Multimedia App's
Publisher: Wilsibs, LLC, License: Shareware, Price: USD $19.00, File Size: 456.0 KB
Platform: Windows
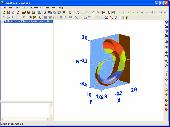
With this interesting fractal software, you can use Newton's method to solve a complex equation and show the fractal Graph in the Plot area. Mandelbrot set and Julia set can also be plotted. Graphs created can be saved as bmp files. With this interesting fractal software, you can use Newton's method to solve a complex equation and show the fractal Graph in the Plot...
Category: Home & Education / Mathematics
Publisher: GraphNow, License: Demo, Price: USD $30.00, File Size: 1.3 MB
Platform: Windows
StockProfits is a utility which will help those of us who make lots of Trades with a Stock broker every year. These Trades are typically presented in a file (CSV or Excel), listed by date. But it takes time to align buys with sales. StockProfits imports symbol/buy/sell data ("input file"), then calculates and reports a summary of the profits. Reporting formats include...
Category: Business & Finance
Publisher: Website-2000, License: Freeware, Price: USD $0.00, File Size: 488.3 KB
Platform: Windows
Tradeplan DJI has a back tested gain of over 215% since Jan 4th, 2005, with an average of only 7 Trades per month.Tradeplan DJI filters the entire Stock market down to the most active 30 blue chip stocks of the Dow Jones Industrial Average Index.Trend TradingTradeplan DJI determines the price trend of each Stock, and targets stocks that have moved upwards in price. When no...
Category: Business & Finance / Business Finance
Publisher: Tradeplan Software, License: Shareware, Price: USD $49.00, File Size: 1.7 MB
Platform: Windows
 Demo
Demo
Imagine a complete Graphing solution assisting you right from importing data and manipulating data, plotting graphs, customizing looks, saving and exporting your graphs as high quality images and producing dynamic reports of your data in a matter of a few easy steps. Features: Data Import: Connects effortlessly with your MS SQL Server, Oracle, Access, XLS and CSV files and additionally...
Category: Software Development / Databases & Networks
Publisher: Teknowledge LLC, License: Demo, Price: USD $99.00, File Size: 8.1 MB
Platform: Windows
Shareware
CharTTool is an advanced Stock charting software that instantly allows you to display several technical charts of stocks, mutual funds or indices. Intraday and end-of-day Stock charting is available. The list of technical indicators includes Bollinger bands, price channels, moving averages, fast and slow stochastic oscillators, relative strength index, MACD, trading volume and...
Category: Business & Finance / Business Finance
Publisher: Ashkon Technology LLC, License: Shareware, Price: USD $39.95, File Size: 1.1 MB
Platform: Windows, Other
Cumulative Probability Plot does all of the statistical mathematics for you and outputs the data in a visual format that can be easily interpreted by people with a limited knowledge of statistics.
The Graph is also useful for a quick demonstration to regulators or other interested parties that your product or process is within acceptable tolerance or meets regulatory...
Category: Multimedia & Design / Multimedia App's
Publisher: Rad Pro Calculator, License: Freeware, Price: USD $0.00, File Size: 8.8 MB
Platform: Windows