Free Downloads: Plotting Graph
Chart java applet software to generate dynamic charts and graphs within JSP, servlets or java applications - bar, line, pie, stacked and grouped charts in 2D and 3D with a wide range of parameters and chart types. Main features: Charts in 2D/3D, Anti aliasing, Multi language support, Cross browser compatible, Java Script parameter control, Data labels, Contextual data drill down, CSV data...
Category: Software Development
Publisher: Swiftchart Limited, License: Demo, Price: USD $99.00, File Size: 97.7 KB
Platform: Windows, Mac, Linux, Unix, MS-DOS, AS/400
Chart java applet software to generate dynamic charts and graphs within JSP, servlets or java applications - bar, line, pie, stacked and grouped charts in 2D and 3D with a wide range of parameters and chart types. Main features: Charts in 2D/3D, Anti aliasing, Multi language support, Cross browser compatible, Java Script parameter control, Data labels, Contextual data drill down, CSV data...
Category: Software Development / Tools & Editors
Publisher: Swiftchart Limited, License: Demo, Price: USD $99.00, File Size: 97.0 KB
Platform: Windows, Mac, Linux, Unix, MS-DOS, AS, 400
AutoCAD DWG drawing viewer with markup, plotting, rendering, PDF output!
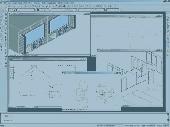
AutoCAD DWG drawing viewer with markup, Plotting, rendering, PDF output! Windows 7 32,Windows 7 64, High precision measuring, zoom. pan, all the features you need to review your AutoCAD drawings and output them to paper. Easy to use, Helps you reduce cycle time and costly printing and Plotting and keeps your entire project team connected, regardless of where they are. ProgeCAD DWG...
Category: Multimedia & Design / Multimedia App's
Publisher: iCADsales.com, License: Shareware, Price: USD $99.00, File Size: 84.8 MB
Platform: Windows
DataPlot is a program where you can import your time based data and graph it.
DataPlot is a program where you can import your time based data and Graph it.You can move easily back and forward in user defined time window, allows individual time setting for each Graph, values read directly in Graph by dragging mouse over the curve and much more
Category: Multimedia & Design / Multimedia App's
Publisher: CBIM, License: Freeware, Price: USD $0.00, File Size: 311.0 KB
Platform: Windows
Drawing graphs without the right tool is simply difficult.
Drawing graphs without the right tool is simply difficult. uDraw(Graph) automates this task for you. Find out how uDraw(Graph) creates your flow charts, diagrams, hierarchies or structure visualizations using automatic layout - much faster than with any standard drawing program. With the API, uDraw(Graph) can even be embedded in your own programs as a visualization component.
Category: Multimedia & Design / Image Editing
Publisher: University Bremen, FB3, Germany, License: Freeware, Price: USD $0.00, File Size: 2.6 MB
Platform: Windows
 Shareware
PlotLab is a set of .NET 2.0-4.5 components for very easy and fast Data Visualization. Also includes a visual graphical editor for codeless development. Contains: - Scope Component - a scientific chart component for Plotting multi-channel data. - Waterfall Component - a single channel waterfall data Plotting component. Especially suitable for FFT, and spectrum...
Category: Software Development / Components: VB
Publisher: Mitov Software, License: Shareware, Price: USD $410.00, File Size: 231.8 MB
Platform: Windows
Shareware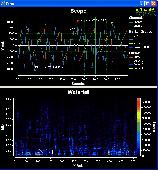
Delphi/C++ Builder VCL and FireMonkey (FMX) components library for very easy and fast Data Visualization. Also includes Visual Graphical Editor for Codeless Development and Visual Live Bindings. Contains: - Scope Component - a scientific chart component for Plotting multi-channel data. - Waterfall Component - a single channel waterfall data Plotting component. Especially...
Category: Software Development / Components: Delphi
Publisher: Mitov Software, License: Shareware, Price: USD $289.00, File Size: 777.3 MB
Platform: Windows
MatheGrafix is an excellent tool that allows you to plot 2D graphs including linear, geometric, exponential, fractals ones and more. The program operates in two modes: you can introduce the formula and plot the Graph or you can draw interactively a geometric function on the Graph.
There are two important windows: the "Mode functions" window which is the main...
Category: Business & Finance / Applications
Publisher: Roland Hammes, License: Freeware, Price: USD $0.00, File Size: 1.8 MB
Platform: Windows
ImageApp is a program that involves a lot of principles from machine vision.
ImageApp is a program that involves a lot of principles from machine vision. A GUI that allows you to build up an image processing Graph. An image processing Graph is essentially a sequence of algorithms that do something to images. You can imagine the Graph as the algorithms being the nodes and the flow-of-->data between the algorithms being the arcs.
For...
Category: Multimedia & Design / Multimedia App's
Publisher: Laurence Smith, License: Shareware, Price: USD $0.00, File Size: 0
Platform: Windows
a powerful, easy-to-use, equation plotter with numerical and calculus features: - Graph Cartesian functions, relations, and inequalities, plus polar, parametric, and ordinary differential equations. - Up to 999 graphs on screen at once. - New data Plotting and curve-fitting features. - Numerically solve and graphically display tangent lines and integrals. - Find critical points,...
Category: Home & Education / Miscellaneous
Publisher: kSoft, Inc., License: Shareware, Price: USD $25.00, File Size: 374.0 KB
Platform: Windows
The WebViewer plug-in enables Windows users whether or not they have SigmaPlot to explore the data used to create the Graph.
Using the WebViewer plug-in with your Web browser window you can:
- View the data used to create the Graph
- Print a Graph in a web document at full resolution
- Zoom in and out of a Graph
- Grab and...
Category: Multimedia & Design / Graphics Viewers
Publisher: SYSTAT Software Inc., License: Freeware, Price: USD $0.00, File Size: 12.6 MB
Platform: Windows
With The Option Strategy Builder you could pick up an option and place it directly to the return Graph. As with the online tool, just drag and drop the option on the Graph, and build your strategy. Using your mouse, the options can be easily moved on the Graph to different strike prices, and to different expiration dates.
With this program you can manage your...
Category: Multimedia & Design / Multimedia App's
Publisher: SamoaSky, License: Freeware, Price: USD $0.00, File Size: 3.1 MB
Platform: Windows

Audio Graph ActiveX is an ActiveX (OCX) component for software developers. With this ActiveX component you can display a meter, detect a silence, and display 2 types of audio graphs by the WaveIn/WaveOut buffers. Just send a pointer of the buffers array to the component then operate the Display function, the component will do the rest on the Graph view. You can set the...
Category: Software Development
Publisher: expresslib.com, License: Shareware, Price: USD $69.00, File Size: 806.5 KB
Platform: Windows
Excel Graph Multiple Equations Software is an application that allows you to plot multiple functions in Microsoft Excel. It is able to create multiple charts based on the formulas entered. You can enter an equation manually or load multiple equations from a text file (.txt). The application is able to plot each equation on an individual Graph or all the equations on a single...
Category: Business & Finance / MS Office Addons
Publisher: Sobolsoft, License: Shareware, Price: USD $19.99, File Size: 2.5 MB
Platform: Windows
New Features of DataStudio:
- Video Player and Synchronization -- Play a movie or synch a movie to experimental data
- Presentation Style Graph -- Additional Graph style that moves measurements and units outside the Graph; ideal for publication of DataStudio graphs in educational journals
- Predictive Sketching -- Students can draw directly on the...
Category: Home & Education / Miscellaneous
Publisher: PASCO, License: Demo, Price: USD $0.00, File Size: 32.8 MB
Platform: Windows

Archim is a program for drawing the graphs of all kinds of functions. You can define a Graph explicitly and parametrically, in polar and spherical coordinates, on a plane and in space (surface). Archim will be useful for teachers and students, as well as for everyone who is interested min geometry. With Archim, you will draw the Graph of any function and form, just use your...
Category: Home & Education
Publisher: Stochastic Lab, License: Freeware, Price: USD $0.00, File Size: 479.6 KB
Platform: Windows
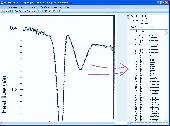
PolarPlot is a program for plotting a polar diagram of an antenna.
PolarPlot is a program for Plotting a polar diagram of an antenna. If you are running an amateur radio station, you need to know the received and transmitting signal strength. For this you need to connect the audio output of the receiver (or transmitter), to the sound-card on your computer through its line-in socket. Once operated, the application will enable you to see the polar diagram...
Category: Business & Finance / Applications
Publisher: G R Freeth, License: Freeware, Price: USD $0.00, File Size: 2.9 MB
Platform: Windows
Graph-A-Ping allows you to visually see the ping latency between ping times.
Graph-A-Ping allows you to visually see the ping latency between ping times. The bigger the gap between one ping to another allows you to spot possible network bottle neck.
This tool is actually an applet part of Glass Net Networks monitoring console.
Category: Internet / Misc. Plugins
Publisher: Mataluis.Com, License: Freeware, Price: USD $0.00, File Size: 2.1 MB
Platform: Windows
3DField is a contouring plotting and 3D data program.
3DField is a contouring Plotting and 3D data program. It converts your data into contour maps, surface or volume plots. 3DField allows create the contours (isolines) on surface from regular data set or scattered points. All aspects of 2D or 3D maps can be customized to produce exactly the presentation you want
Category: Multimedia & Design / Multimedia App's
Publisher: Vladimir Galouchko, License: Shareware, Price: USD $99.00, File Size: 2.7 MB
Platform: Windows
This compact self-contained viewer allows you to view standard 274-X format Gerber Plotting documents. It is designed for use with McCAD created documents and it can also be used to view Gerbers created by other CAD systems. This viewer can also be used to view older 274-D format Gerber Plotting documents.
Category: Multimedia & Design / Image Editing
Publisher: VAMP, Inc., License: Freeware, Price: USD $0.00, File Size: 1.7 MB
Platform: Windows
Genplot: A graphical data analysis and plotting package for scientists and engineers.
Genplot: A graphical data analysis and Plotting package for scientists and engineers. Designed to meet the requirements of serious researchers unafraid of command line oriented programs. Has every analysis feature I've needed in my research - or that one of my collaborators and friends have convinced me would be useful.
Category: Multimedia & Design / Multimedia App's
Publisher: Computer Graphics Service, License: Shareware, Price: USD $75.00, File Size: 7.7 MB
Platform: Windows
Graph FAWM is a function graphing tool that is easy for teachers and students to use.
Graph FAWM is a function graphing tool that is easy for teachers and students to use. A wealth of information is available about any Graph just by moving the mouse pointer to a point of interest.
Category: Business & Finance / Applications
Main Features:
- True algebraic equation format
- Implicit equations
- Locates intercepts, turning points and points of intersection
Publisher: New FAWM Creations, License: Shareware, Price: USD $20.00, File Size: 4.6 MB
Platform: Windows
XYZ Data Viewer is a Excel table to 3-D graph converter.
XYZ Data Viewer is a Excel table to 3-D Graph converter. It provide easy way to analyze a variety of tabular data from Microsoft Excel in the view of 3-dimensions Graph. With this tool You can view and examine your data as a three-dimensional object in three-dimensional space, by manipulate the 3d object on the program screen. You can save this 3d Graph as a file and upload...
Category: Multimedia & Design / Media Management
Publisher: 3 Fish Software, License: Shareware, Price: USD $69.95, File Size: 9.1 MB
Platform: Windows
dcsDigitiser, a Graph digitizer and densitometer, converts graphs into digital X-Y numerical numbers for peer analysis of graphs and gel in the open literature and/or of your own hard copies. With excellent performance, dcsDigitiser is accurate, precise, versatile and straightforward in its use. It is now only a few clicks to get a numerical reading of graphs of interest while surfing on...
Category: Home & Education / Mathematics
Publisher: J & C Consultation and Technology, License: Shareware, Price: USD $120.00, File Size: 3.8 MB
Platform: Windows
3DFieldPro is a contouring plotting and 4D-3D data program.
3DFieldPro is a contouring Plotting and 4D-3D data program. It converts your data into contour maps, surface or volume plots. 3DFieldPro allows create the contours (isolines) on surface and isosurfaces in volume from regular data set or scattered points. All aspects of 2D or 3D maps can be customized to produce exactly the presentation you want
Category: Multimedia & Design / Multimedia App's
Publisher: Vladimir Galouchko, License: Shareware, Price: USD $400.00, File Size: 5.8 MB
Platform: Windows