Free Downloads: Process Control Charts
Flow Charting is a dedicated program designed for the creation, editing, and printing of flow Charts, org Charts, data flow diagrams, and Process Control Charts.
Drawing programs are great for drawings - but not for flowcharts. If you are using a drawing program or some other program with "flowcharting tools" to create your flowcharts,...
Category: Multimedia & Design / Fonts
Publisher: Patton & Patton Software Corporation, License: Shareware, Price: USD $159.00, File Size: 11.0 MB
Platform: Windows
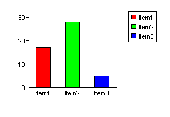
ADSS Charts Control designed to display three types of Charts: Horizontal bar Chart, Vertical bar Chart, Pie Chart, key Features: supports Captions and Values.Text can be aligned,Control allows to display text information inside and outside chart elements. Chart data can be grouped in Groups. Can be updated in real-time for creating of animated Charts....
Category: Software Development / Components & Libraries
Publisher: Advanced Software Solutions, License: Shareware, Price: USD $47.00, File Size: 716.8 KB
Platform: Windows
The SPC Training Simulator has been found very effective for training in classroom environment as well as for self-learning. It is being successfully used by Quality Managers, Facilitators, Trainers, and Consultants.
Use this software to simulate and study:
- Fundamentals of Normal Distribution
- Control Charting and its physical significance
- Detection of...
Category: Home & Education / Teaching Tools
Publisher: Symphony Technologies, License: Shareware, Price: USD $99.00, File Size: 3.3 MB
Platform: Windows
Including both an ASP.NET web Control and a direct imaging component, Active Org-Chart provides easy, interactive, and beautiful hierarchical Charts for any application. Unique to the ASP.NET Control is the ability to move organizations by dragging and dropping them directly on your page. This Control is fully stylable, giving you total Control over the...
Category: Web Authoring / Scripts & CGI Tools
Publisher: Data Research Group, License: Demo, Price: USD $49.50, File Size: 2.2 MB
Platform: Windows
Practitioners of Statistical Process Control (SPC) need to have a very clear understanding of what SPC is and how it works. For years a mechanical Quincunx model that drops balls over number of pins and simulates real-life processes has been used for this learning.
Here is the SPC Training Simulator Software that has several additional features to the physical Quincunx.The...
Category: Business & Finance / Applications
Publisher: Symphony Technologies, License: Shareware, Price: USD $99.00, File Size: 3.3 MB
Platform: Windows
Chart Control .NET is the perfect solution to add the most advanced, feature rich Charts to Windows Forms and ASP.NET applications. Over 40 major 2D/3D Charts are available, such as traditional area, bar, column, line and pie Charts, financial bars and Japanese candlesticks, Kagi and Renko Charts and others. Flexible areas filling, scaling, legends, grid,...
Category: Software Development
Publisher: .Net Charting Software, License: Shareware, Price: USD $39.99, File Size: 4.7 MB
Platform: Windows
Operates in English (I-P) or metric (SI) units.
Operates in English (I-P) or metric (SI) units.
Create high quality, customized psychrometric Charts.
Plot your Process data with state point labels.
Print a report of state points and processes.
Add notes and annotations.
Define and plot zones on your Charts, (e.g. comfort zones)
Copy/paste Charts to your presentation or word...
Category: Multimedia & Design / Digital Media Editors
Publisher: Linric Company, License: Shareware, Price: USD $149.95, File Size: 20.2 MB
Platform: Windows
NetDiagram is a general-purpose software component that can be used to display various types of flow diagrams and Charts in web applications. It is implemented as a .NET web Control and can be easily integrated into any project targeting the Microsoft ASP.NET platform. NetDiagram can give graphical representation to object hierarchies, graphs and networks, entity-relationship...
Category: Software Development
Publisher: MindFusion LLC, License: Commercial, Price: USD $500.00, File Size: 4.4 MB
Platform: Windows
The QI Macros SPC Software for Excel draws pareto Charts, Control Charts, histograms, box and whisker plots, scatter plots and more. There are four "wizards" that figure out what chart or statistic to draw based on your data. Better yet we do it right in Excel. Your just select your data and then select the chart from the QI Macros menu. It also includes over 90...
Category: Business & Finance / MS Office Addons
Publisher: KnowWare International, Inc., License: Shareware, Price: USD $199.00, File Size: 12.7 MB
Platform: Windows
The Plot control created to display graphs and charts on .
The Plot Control created to display graphs and Charts on .NET Windows Forms. Advantages of this Control are very quick embedding into your application and powerful features. Written using 100% managed code. Also, this Control can be used to create animated graphs. With this Control You can: draw lines just from arrays, use gradients to fill lines colors, draw...
Category: Software Development / Components & Libraries
Publisher: Advanced Software Solutions, License: Shareware, Price: USD $19.00, File Size: 1.1 MB
Platform: Windows
All charts are displayed in one window.
All Charts are displayed in one window. User may compare different Charts of one stock or Charts of different stocks easily.
- Advanced indicators: EquiVolume, Point & Figure, GMMA, Heiken-Ashi, Volatility Stop Loss.
Point & Figure Charts consist of columns of X's and O's that represent filtered price movements over time. It is...
Category: Multimedia & Design / Multimedia App's
Publisher: Stock-Anal, License: Shareware, Price: USD $0.00, File Size: 0
Platform: Windows
Tool to easily follow the stock market using Point and Figure charts.
Tool to easily follow the stock market using Point and Figure Charts. Get a set of updated Charts everyday in your mailbox (or if you prefer download the Charts files from our website) We have Charts of the following markets: US US mutual funds, ETF's and iShares Canada United Kingdom Europe Australia Select stocks in minutes with our 'Buy the Winner' view! Comes...
Category: Business & Finance / Applications
Publisher: Magic Potion, License: Demo, Price: USD $49.00, File Size: 7.6 MB
Platform: Windows,
WpfDiagram adds to applications the ability to create and present various kinds of diagrams: - flowchart and Process diagrams - workflow and data flow Charts - database entity-relationship diagrams - organizational and classification Charts - hierarchy and relationship diagrams - networks and graphs The basic types of diagram elements - boxes, tables, and arrows - can be...
Category: Software Development / Components & Libraries
Publisher: MindFusion LLC, License: Commercial, Price: USD $500.00, File Size: 6.4 MB
Platform: Windows
QC-CALC SPC is a complete SPC package that analyzes the data collected by QC-CALC Real-Time.
QC-CALC SPC is a complete SPC package that analyzes the data collected by QC-CALC Real-Time. Use QC-CALC SPC’s Charts and reports to constantly monitor your Process and keep it in Control.
QC-CALC SPC offers a wide variety of Charts and functions to aid your analysis and give you the power to make on-the-spot decisions. In seconds, QC-CALC SPC...
Category: Internet / Monitoring
Publisher: Prolink Inc., License: Shareware, Price: USD $1500.00, File Size: 65.9 MB
Platform: Windows
Your objective is to use one software system to collect bathymetry, sonar data and magnetometer data, Process this data, produce Charts or even produce S-57 Electronic Navigation Charts(ENC).
QINSy is a suite of hydrographic applications that covers that whole range of activities, from data acquisition to chart production.
Category: Business & Finance / Business Finance
Publisher: QPS, License: Shareware, Price: USD $0.00, File Size: 0
Platform: Windows
ActiveX/OCX Control to draw 2D pie Charts, bar Charts & line graphs. As well as displaying the graphs they can be exported to file in gif, png, bmp, jpg or pcx format. Output can be exported as binary data for use with web applications, or copied to the clipboard. A comprehensive selection of properties allow Control over colours, fonts, formatting and layout. Pie...
Category: Software Development
Publisher: Chestysoft, License: Demo, Price: USD $60.00, File Size: 976.3 KB
Platform: Windows
Sigma XL is a Microsoft Excel third-party add-in that allows statistical professionals to enhance basic Excel's Charts and reports. Excel is the common application to enter data and gather most numerical information, however, its statistical reports functionality is limited, as the data must be exported to other application to get specific reports/Charts.
The...
Category: Business & Finance / Applications
Publisher: SigmaXL, License: Shareware, Price: USD $249.00, File Size: 47.7 MB
Platform: Windows
Do you want to learn how to draw? Now you can online! Learn how to draw like an local application with EDraw ActiveX Control, that lets you quickly build basic flowcharts, organizational Charts, business Charts, hr diagram, work flowchart, programming flowchart and network diagrams. It is a MFC based ActiveX Control, compiled with Microsoft VC++ 6.0!
Category: Software Development / ActiveX
Publisher: EdrawSoft, License: Shareware, Price: USD $299.00, File Size: 3.2 MB
Platform: Unknown


 Shareware
FusionCharts for Flex is a charting component for Adobe Flex solutions. It helps you create interactive Charts and graphs in your Flex projects. The Charts are powered by FusionCharts v3 framework - the industry leader in Adobe Flash Charting. FusionCharts for Flex offers over 45 chart types spanning both 2D and 3D Charts, including: * Standard Charts like...
Category: Software Development / Components & Libraries
Publisher: InfoSoft Global (P) Ltd., License: Shareware, Price: USD $299.00, ALL1499, File Size: 14.5 MB
Platform: Windows, Mac, Linux, Unix
eZ SPC software is developed by Dr.
eZ SPC software is developed by Dr. Chang W. Kang, professor, Department of Industrial & Management Engineering and his SEAQ (Statistical Engineering for Advanced Quality) research team at Hanyang University ERICA campus, South Korea. eZ SPC is a simple and user-friendly software package that includes basic QC tools, probability distributions, descriptive statistics, graphical analysis,...
Category: Business & Finance / Business Finance
Publisher: Hanyang SEAQ Lab, License: Freeware, Price: USD $0.00, File Size: 7.7 MB
Platform: Windows
Rapid Charts provides the tools you need to help make creating Charts and graphs for use in web sites or applications as straightforward as possible. Chart definitions allow you to easily save the chart for later use, save the definition to a shared database to share the chart with others or for use in a web page. Charts can be saved to a jpg or png file for inclusion in...
Category: Audio / Utilities & Plug-Ins
Publisher: LLamedos Software, License: Shareware, Price: USD $14.95, File Size: 4.2 MB
Platform: Windows
Chart Trainer -Learn to read nautical charts like an expert.
Chart Trainer -Learn to read nautical Charts like an expert.
Chart Trainer is designed to help mariners interpret nautical Charts and use them more efficiently, both traditional paper Charts and new digital Charts for computers. The materials cover all aspects of nautical Charts in the most detail available, including tutorials on chart reading and...
Category: Home & Education / Teaching Tools
Publisher: Starpath School of Navigation, License: Shareware, Price: USD $39.00, File Size: 39.8 MB
Platform: Windows
MindFusion.Charting.WebForms provides applications targeting the .NET platform the ability to create and display various kinds of Charts. The component supports bar, pie, doughnut, scatter, bubble, line, area, radar and polar Charts. Many features of MindFusion.Charting.WebForms output can be customized in a way that suits your project best. Charts can have different...
Category: Software Development / Misc. Programming
Publisher: MindFusion, License: Demo, Price: USD $0.00, File Size: 5.0 MB
Platform: Windows
flin4pay is personal accounting software to control payments and optimize family expenses planning.
flin4pay is personal accounting software to Control payments and optimize family expenses planning. Using this program you will find practical management software for personal and familiar budget.Also without being expert, you will be able to manage with simplicity your family accounts evidencing the heavy costs or planning your actions. In little steps, you will always have your...
Category: Business & Finance / Personal Finance
Publisher: flinsoft, License: Shareware, Price: USD $24.00, File Size: 19.1 MB
Platform: Windows


 Commercial
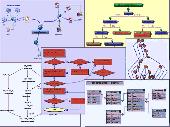
FlowChart.NET adds to applications the ability to create and present various kinds of diagrams: - flowchart and Process diagrams - workflow and data flow Charts - database entity-relationship diagrams - organizational and classification Charts - hierarchy and relationship diagrams - networks and graphs The basic types of diagram elements - shapes, tables, and...
Category: Software Development / Components & Libraries
Publisher: MindFusion LLC, License: Commercial, Price: USD $300.00, File Size: 25.8 MB
Platform: Windows


