Free Downloads: Radial Scatter Chart
Create stunning 3D bubble charts in Excel with 5dchart Add-In! 5dchart Add-In for Microsoft Excel is an easy-to-use tool for multi-dimensional data visualization. It allows you to display a 3D bubble Chart with two additional parameters: 3D coordinates of each bubble and bubble size and colour. Of course, it is the easy way to create 3D Scatter plot too. 5dchart Add-In is designed...
Category: Business & Finance / MS Office Addons
Publisher: System Approach Ltd., License: Shareware, Price: USD $99.90, File Size: 809.0 KB
Platform: Windows
 Shareware
XML Flash charts are easy to make using Animated Chart Pro. Create dynamic web Chart with live data permanently updated from XML source. Animated Chart Pro edition generates real time web charts using dynamic data and all you have to do is to customize Chart appearance, get the result and embed an interactive dynamic flash Chart into your Web page. Flash...
Category: Web Authoring / Website Animation Tools
Publisher: Flarium, License: Shareware, Price: USD $69.00, File Size: 2.7 MB
Platform: Windows
Commercial
Charting tool for the rapid design of 13 different Chart types, including bar, dot, horizontal bar, line, pie, donut, Scatter, xy, area, histogram, error bar, bubble, gantt and volume charts. Additional features include 3D, multiple datasets, gradients, transparency, unlimited annotations, and smoothing. Can be exported to files of types BMP, GIF, PNG, PS, PDF, EMF, JPG, SVG....
Category: Business & Finance / Applications
Publisher: Creative-PC, License: Commercial, Price: USD $49.00, File Size: 7.6 MB
Platform: Windows
The QI Macros SPC Software for Excel draws pareto charts, control charts, histograms, box and whisker plots, Scatter plots and more. There are four "wizards" that figure out what Chart or statistic to draw based on your data. Better yet we do it right in Excel. Your just select your data and then select the Chart from the QI Macros menu. It also includes over 90...
Category: Business & Finance / MS Office Addons
Publisher: KnowWare International, Inc., License: Shareware, Price: USD $199.00, File Size: 12.7 MB
Platform: Windows
User can paint individual lines by dragging the cursor over lines and identify data interactively.
User can paint individual lines by dragging the cursor over lines and identify data interactively.
In this version of Data Paint you have interactive Rotating Scatter Plot, Simple Scatter Plot, Bar Chart, Star Plot and Parallel Coordinate Plot.
This software can be customized for a specific need.
Category: Business & Finance / Business Finance
Publisher: Man Machine Interface, Inc, License: Freeware, Price: USD $0.00, File Size: 2.4 MB
Platform: Windows
DynaPlot is a real-time chart control for technical and scientific applications.
DynaPlot is a real-time Chart control for technical and scientific applications. Built-in tools such as autoscale, pan, scroll, stacked zoom, and cursors let the user examine the data quickly and easily. Features include line, bar, and Scatter plots; dynamic scaling of Chart elements with window extent; limit lines and tolerance masks with highlighted tolerance violations...
Category: Software Development / Tools & Editors
Publisher: Wilhelm Kurz, License: Shareware, Price: USD $240.00, File Size: 2.4 MB
Platform: Windows
Shareware
Nevron Chart for .NET is designed to be flexible, efficient and extensible. Combining a vast amount of features in an intuitive and straightforward programming model, the component can display virtually any 2D or 3D Chart including: Bar, Line, Step Line, Area, Pie, Point, Bubble, Stock, Floating Bar, Radar, Polar, High Low, Mesh Surface, Grid Surface, Shape, Smooth Line, Float...
Category: Software Development / Components & Libraries
Publisher: Nevron Software LLC, License: Shareware, Price: USD $589.00, File Size: 245.0 MB
Platform: Windows
Nevron Chart for .NET is designed to be extensible, efficient and feature rich. It wraps a vast amount of features in an intuitive and straightforward programming model. The component can display virtually any 2D or 3D Chart including: Bar, Line, Step Line, Area, Pie, Point, Bubble, Stock, Floating Bar, Radar, Polar, High Low, Mesh Surface, Grid Surface, Shape, Smooth Line, Float...
Category: Software Development / Components & Libraries
Publisher: Nevron Software, License: Shareware, Price: USD $589.00, File Size: 156.2 MB
Platform: Windows
Shareware
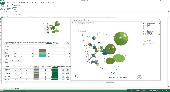
BAT Desktop is a Business Intelligense software for data visualization and OLAP reporting. You can analyze your data by building pivot tables, charts, treemaps, Scatter diagrams, filtering/sorting/searching for patterns, etc. Product features: - Reports are generated quickly on a vast amount of data; - You can easily perform ad-hoc reporting on your own without bringing in of...
Category: Business & Finance / Applications
Publisher: BIT Impulse, License: Shareware, Price: USD $149.00, File Size: 28.7 MB
Platform: Windows
DynaPlot is a real-time chart control for technical and scientific applications.
DynaPlot is a real-time Chart control for technical and scientific applications. Built-in tools such as autoscale, pan, scroll, stacked zoom, and cursors let the user examine the data quickly and easily. Features include line, bar, and Scatter plots; dynamic scaling of Chart elements with window extent; limit lines and tolerance masks with highlighted tolerance violations...
Category: Software Development / ActiveX
Publisher: Wilhelm Kurz, License: Shareware, Price: USD $0.00, File Size: 2.0 MB
Platform: Windows
AnyChart is a robust and superfast JavaScript charting library to add great-looking, interactive HTML5 charts into any project, in any browser, and on any platform/OS including mobile ones. AnyChart provides advanced customization and flexibility opportunities, no matter if you are developing a website, a business intelligence application (BI) for corporate usage, or some software for your...
Category: Web Authoring / JavaScript
Publisher: AnyChart JavaScript Charts, License: Shareware, Price: USD $49.00, File Size: 17.8 MB
Platform: Windows, Mac, Linux,
Shareware
Nevron Chart for SQL Server Reporting Services (SSRS) is an advanced report item, delivering a complete set of 2D and 3D charting types, highly customizable axes, tight data integration and unmatched visual effects to your reports. It instantly improves your report authoring experience, with its polished visual editors, exhaustive and refined settings and well-organized structure....
Category: Business & Finance / Database Management
Publisher: Nevron Software LLC, License: Shareware, Price: USD $889.00, File Size: 182.2 MB
Platform: Windows

Chart java applet software to generate dynamic charts and graphs - bar, line, pie, stacked and grouped charts in 2D and 3D with a wide range of parameters and Chart types. Main features: Charts in 2D/3D, Anti aliasing, Multi language support, Cross browser compatible, Java Script parameter control, Data labels, Contextual data drill down, CSV data sources, Trend calculation, 3D...
Category: Multimedia & Design
Publisher: Swiftchart Limited, License: Demo, Price: USD $99.00, File Size: 97.7 KB
Platform: Windows, Mac, Linux, Unix, MS-DOS, AS/400
Shareware
This WPF product contains number of linear,digital and Radial gauges, that aim to visualize changing data. It is a great set of components that can visualize data in a user friendly way. We propose number of gauges and related components for a low price, with support and updates( New Components and features will be added within your subscription). Among components you can find a few...
Category: Software Development / Installation Programs
Publisher: FPS Components, License: Shareware, Price: USD $199.00, File Size: 293.0 KB
Platform: Windows
Chart java applet software to generate dynamic charts and graphs - bar, line, pie, stacked and grouped charts in 2D and 3D with a wide range of parameters and Chart types. Main features: Charts in 2D/3D, Anti aliasing, Multi language support, Cross browser compatible, Java Script parameter control, Data labels, Contextual data drill down, CSV data sources, Trend calculation, 3D...
Category: Software Development / Tools & Editors
Publisher: Swiftchart Limited, License: Demo, Price: USD $99.00, File Size: 97.0 KB
Platform: Windows, Mac, Linux, Unix, MS-DOS, AS, 400
Aspose.Chart is a .Net charting component. With it, you can: ceeate more than 20 basic charts types including Area, Bar, Bubble, Contour, Candlestick, Cube, Curve, CurveArea, Doughnut, Gantt, HighLowClose, Line, OpenHighLowClose, Pareto, Pie, Pyramid, Point, Radar, Scatter, Step, Surface, etc; Create charts with effects including 3D, frame border, anti-alias, transparency,...
Category: Software Development / Components & Libraries
Publisher: Aspose Pty Ltd, License: Shareware, Price: USD $249.00, File Size: 1.1 MB
Platform: Windows

Chart java applet software to generate dynamic charts and graphs within JSP, servlets or java applications - bar, line, pie, stacked and grouped charts in 2D and 3D with a wide range of parameters and Chart types. Main features: Charts in 2D/3D, Anti aliasing, Multi language support, Cross browser compatible, Java Script parameter control, Data labels, Contextual data drill down,...
Category: Software Development
Publisher: Swiftchart Limited, License: Demo, Price: USD $99.00, File Size: 97.7 KB
Platform: Windows, Mac, Linux, Unix, MS-DOS, AS/400
Demo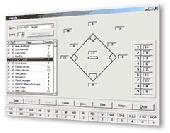
Baseball Manager handles all of the administrative tasks of running your team. Create rosters, game and practice schedules; build inning-by-inning line-ups; enter player and team stats; track all hit balls with the Scatter Chart. * Track 53 pitching, 50 hitting and 15 fielding stats - all the baseball stats and softball stats you could ever need. * Create 9 or 10 player...
Category: Home & Education / Sports
Publisher: Shade Tree Software, License: Demo, Price: USD $49.95, File Size: 10.9 MB
Platform: Windows
Chart java applet software to generate dynamic charts and graphs within JSP, servlets or java applications - bar, line, pie, stacked and grouped charts in 2D and 3D with a wide range of parameters and Chart types. Main features: Charts in 2D/3D, Anti aliasing, Multi language support, Cross browser compatible, Java Script parameter control, Data labels, Contextual data drill down,...
Category: Software Development / Tools & Editors
Publisher: Swiftchart Limited, License: Demo, Price: USD $99.00, File Size: 97.0 KB
Platform: Windows, Mac, Linux, Unix, MS-DOS, AS, 400
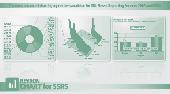
Nevron Chart for SQL Server Reporting Services (SSRS) is an advanced report item, which delivers a complete set of 2D and 3D charting types, highly customizable axes, tight data integration and unmatched visual effects to your reports. It also instantly improves your report authoring experience, with its polished visual editors, exhaustive and refined settings and well-organized...
Category: Business & Finance / Database Management
Publisher: Nevron Software, License: Shareware, Price: USD $889.00, File Size: 11.8 MB
Platform: Windows
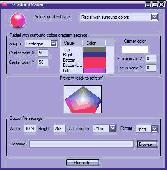
Small utility for creating different images with different gradient fill, for such purposes as wallpaper background, for example. Works with linear, Radial (shaped) and Radial with surround colors (shaped) gradients. All gradient could be multi-colored. Output file formats are Jpeg, Png, Tiff, bmp. Output file could be any size, any color depth. Could check for new version.
Category: Multimedia & Design
Publisher: Robin programmer, License: Freeware, Price: USD $0.00, File Size: 175.4 KB
Platform: Windows
Shareware
Super 2d/3d Graph Library is a customizable and powerful, yet light, .NET libray for drawing eye-candy charts and/or export them into PDF format, vector (Scalable Vector Graphics or SVG) and raster graphics file formats such as JPG, GIF, PNG, BMP, ... Same component may be used in WinForms or ASP.NET applications. Powerful features such as high resolution render, additional calculations, smart...
Category: Software Development / Components & Libraries
Publisher: Software Siglo XXI, License: Shareware, Price: USD $129.00, EUR99, File Size: 1.2 MB
Platform: Windows
Chart Trainer -Learn to read nautical charts like an expert.
Chart Trainer -Learn to read nautical charts like an expert.
Chart Trainer is designed to help mariners interpret nautical charts and use them more efficiently, both traditional paper charts and new digital charts for computers. The materials cover all aspects of nautical charts in the most detail available, including tutorials on Chart reading and plotting, along...
Category: Home & Education / Teaching Tools
Publisher: Starpath School of Navigation, License: Shareware, Price: USD $39.00, File Size: 39.8 MB
Platform: Windows
KG-Chart for Cross Stitch" is a program to design a chart for cross stitching.
KG-Chart for Cross Stitch" is a program to design a Chart for cross stitching.
The ability to draw each stitch with a color and mark makes it easier for users to create a pattern for cross stitching. Usual painting software can't do this.
With this program you can print a Chart and a color table in which pages are automatically divided.
It also...
Category: Software Development / Help File Utilities
Publisher: Mozusystems, LLC, License: Shareware, Price: USD $0.00, File Size: 1.2 MB
Platform: Windows
KG-Chart for Cross Stitch" is a program to design a chart for cross stitching.
KG-Chart for Cross Stitch" is a program to design a Chart for cross stitching. This program has following features:
* Drawing pixels with mark to distinguish color.
* Color palette (mimic DMC's thread color).
* Drawing backstitching
* Print/Preview/Real view of a Chart.
* Import/Export a Chart to/from other image...
Category: Multimedia & Design / Multimedia App's
Publisher: Keiji Ikuta Software Laboratory, License: Freeware, Price: USD $0.00, File Size: 1.1 MB
Platform: Windows