Free Downloads: Regression Graph
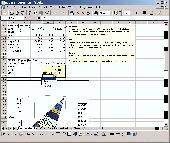
Performs linear regression using the Least Squares method.
Performs linear Regression using the Least Squares method. Determines the Regression coefficients, the generalized correlation coefficient and the standard error of estimate. Does multivariate Regression. Displays 2D and 3D plots.
Category: Business & Finance / Personal Finance
Publisher: Numerical Mathematics, License: Shareware, Price: USD $15.00, File Size: 1.7 MB
Platform: Windows
Powerful but easy-to-use graphing, curve fitting and calculating software. Graphs Cartesian (Y(x) and X(y)), polar and parametric functions, graphs of tables, equations (implicit functions), inequalities and slope fields. Up to 100 graphs in one window. Calculus features: Regression analysis, obtaining zeroes and extrema of functions, intersections, derivatives, equations of tangents and...
Category: Home & Education
Publisher: Alentum Software, Inc., License: Shareware, Price: USD $29.95, File Size: 1.1 MB
Platform: Windows
Rt-Plot is a tool to generate Cartesian X/Y-plots from scientific data.
Rt-Plot is a tool to generate Cartesian X/Y-plots from scientific data. You can enter and calculate tabular data. View the changing graphs, including linear and non linear Regression, interpolation, differentiation and integration, during entering. Rt-Plot enables you to create plots fast and easily. The line calculations give full access to calculation and display ranges and can use...
Category: Home & Education / Mathematics
Publisher: Rt-Science, License: Shareware, Price: USD $29.90, File Size: 5.2 MB
Platform: Windows
Least Cubic Method is a new method for data Regression analyse , it expanded Least Square Method, According to the principle, this program can be used to work out single factor linear data Regression, multi factors linear data Regression, single factor non-linear data Regression, and multifactors non-linear data Regression.
Category: Business & Finance / Business Finance
Publisher: AiHua Computer Studio, License: Freeware, Price: USD $0.00, File Size: 5.9 MB
Platform: Windows
BayesX is a software tool for estimating structured additive regression models.
BayesX is a software tool for estimating structured additive Regression models. Structured additive Regression embraces several well-known Regression models such as generalized additive models (GAM), generalized additive mixed models (GAMM), generalized geoadditive mixed models (GGAMM), dynamic models, varying coefficient models (VCM), and geographically weighted...
Category: Business & Finance / Applications
Publisher: LMU Munich, License: Freeware, Price: USD $0.00, File Size: 29.3 MB
Platform: Windows
XLMiner for Excel for Windows is the only comprehensive data mining add-in for Excel, with neural nets, classification and Regression trees, logistic Regression, linear Regression, Bayes classifier, K-nearest neighbors, discriminant analysis, association rules, clustering, principal components, and more.
Category: Business & Finance / MS Office Addons
Publisher: Frontline Systems, Inc., License: Shareware, Price: USD $995.00, File Size: 18.2 MB
Platform: Windows
Performs multivariate polynomial regression using the Least Squares method.
Performs multivariate polynomial Regression using the Least Squares method. The program determines the coefficients of the polynomial, the generalized correlation coefficient and the standard error of estimate.
Category: Home & Education / Mathematics
Publisher: Numerical Mathematics, License: Shareware, Price: USD $15.00, File Size: 1.7 MB
Platform: Windows
Rt-Tools2D is a selection of components to generate two dimensional Cartesian plots: *TRtCaptionEdit: This is a special edit control supporting enhanced styles as bold, italic, underline, strikeout, subscript, superscript and symbol font. This is especially interesting to alter TRtLabels which supports the same styles. *TRtLabel: Label supporting enhanced styles as bold, italic, underline,...
Category: Software Development
Publisher: Rt-Science, License: Shareware, Price: USD $140.00, File Size: 6.3 MB
Platform: Windows
Create your own custom sheets of Graph paper. You have complete control over the Graph characteristics. X and Y axis can independently be set for linear or log scale. Selection from a dozen standard paper sizes, or custom create your own. Graphs saved as pdf files you can print them whenever you wish. Choose whatever color you want for the lines. Specify independent line weights...
Category: Home & Education
Publisher: Black Cat Systems, License: Shareware, Price: USD $19.99, File Size: 1.4 MB
Platform: Windows
The Multiple Regression Analysis and Forecasting template enables the confident identification of value drivers and forecasting business plan or scientific data. The multiple Regression process utilizes commonly employed statistical measures to test the validity of the analysis and results are summarized in text form to be easily understood. When predictive relationships have...
Category: Business & Finance / Spreadsheets
Publisher: Business Spreadsheets, License: Shareware, Price: USD $19.00, EUR15, File Size: 167.0 KB
Platform: Windows, Mac
Graph Studio is the open source graph drawing/processing software.
Graph Studio is the open source Graph drawing/processing software. It allows users to build and process highly customizable graphs.
Category: Multimedia & Design
Publisher: sourceforge.net, License: Freeware, Price: USD $0.00, File Size: 118.0 KB
Platform: Windows, Mac, Vista
Sagata Multiple Regression software offers the power of a professional Regression package with the ease and comfort of a Microsoft Excel interface. Features include: Qualitative/Categorical Factors - often inputs or factors in model fitting are qualitative or categorical in nature, e.g., the type of house (brick, cape cod, or colonial) or the school district name. S.R. Pro...
Category: Business & Finance
Publisher: Sagata Ltd, License: Freeware, Price: USD $0.00, File Size: 8.0 MB
Platform: Windows
LAB Fit is a software for Windows developed for treatment and analysis of experimental data.
LAB Fit is a software for Windows developed for treatment and analysis of experimental data. At LABFit program you are able to:
1) Treat similar data (grouped and ungrouped dataset, one or two samples);
2) Treat non-similar data;
3) Determine propagated error (error propagation up to eight independent variables);
4) Plot 2D and 3D Graph (normal, parametric, imported...
Category: Home & Education / Science
Publisher: Wilton Pereira da Silva, License: Shareware, Price: USD $60.00, File Size: 3.3 MB
Platform: Windows
Fast Statistics is a statistical analysis program for Microsoft Excel.
Fast Statistics is a statistical analysis program for Microsoft Excel. It is can be used as an add-on for it and also it can be installed as a stand-alone application, so there is no need to have MS-Excel installed. It can complete different tasks from manipulations of basic data up to the advanced statistical analysis to produce sophisticated reports and charts. This tool is perfect for Six...
Category: Business & Finance / MS Office Addons
Publisher: Fatesoft.com, License: Shareware, Price: USD $49.95, File Size: 3.6 MB
Platform: Windows
Chart java applet software to generate dynamic charts and graphs - bar, line, pie, stacked and grouped charts in 2D and 3D with a wide range of parameters and chart types. Main features: Charts in 2D/3D, Anti aliasing, Multi language support, Cross browser compatible, Java Script parameter control, Data labels, Contextual data drill down, CSV data sources, Trend calculation, 3D depth control,...
Category: Software Development / Tools & Editors
Publisher: Swiftchart Limited, License: Demo, Price: USD $99.00, File Size: 97.0 KB
Platform: Windows, Mac, Linux, Unix, MS-DOS, AS, 400
ZGrapher is a simple graphic utility.
ZGrapher is a simple graphic utility. It can be helpful for any user, from a schoolboy to a professional mathematician. Using this program you can plot graphs of the following types: Y(x), X(y), R(a) – in polar coordinates, X(t) and Y(t) – parametric equations and graphs of tables. To create a Graph you should specify its parameters – formula, Graph’s...
Category: Home & Education / Mathematics
Publisher: Palam Software, Inc., License: Freeware, Price: USD $0.00, File Size: 619.8 KB
Platform: Windows

Chart java applet software to generate dynamic charts and graphs - bar, line, pie, stacked and grouped charts in 2D and 3D with a wide range of parameters and chart types. Main features: Charts in 2D/3D, Anti aliasing, Multi language support, Cross browser compatible, Java Script parameter control, Data labels, Contextual data drill down, CSV data sources, Trend calculation, 3D depth control,...
Category: Multimedia & Design
Publisher: Swiftchart Limited, License: Demo, Price: USD $99.00, File Size: 97.7 KB
Platform: Windows, Mac, Linux, Unix, MS-DOS, AS/400
CurveExpert is a comprehensive curve fitting system for Windows.
CurveExpert is a comprehensive curve fitting system for Windows. XY data can be modelled using a toolbox of linear Regression models, nonlinear Regression models, interpolation, or splines. Over 30 models are built-in, but custom Regression models may also be defined by the user. Full-featured graphing capability allows thorough examination of the curve fit. The process of...
Category: Business & Finance / Applications
Publisher: Hyams Development, License: Shareware, Price: USD $45.00, File Size: 1.1 MB
Platform: Windows
Website and Web Application Testing.
Regression Tester from Info-Pack.com allows you to test the functionality of any page or form on your website. Simply build up a list of tests in the program, then press the test button. The program will then run the tests and create a professional report. The reports are fully customizable. RegressionTester is a windows program that runs on your PC and tests your website...
Category: Software Development
Publisher: RegressionTester, License: Shareware, Price: USD $99.95, File Size: 932.6 KB
Platform: Windows
 Shareware
CurveFitter performs statistical Regression analysis to estimate the values of parameters for linear, multivariate, polynomial, exponential and nonlinear functions. The Regression analysis determines the values of the parameters that cause the function to best fit the observed data that you provide. This process is also called curve fitting. Fit thousands of data into your...
Category: Home & Education / Mathematics
Publisher: Institute of Mathematics and Statistics, License: Shareware, Price: USD $15.00, File Size: 3.1 MB
Platform: Windows, Other
Graph constructs, visualizes and modifies graphs as well as calculates measures and layouts.
Graph constructs, visualizes and modifies graphs as well as calculates measures and layouts.
CoSBiLab Graph can construct, visualize and modify graphs as well as calculate measures and layouts. CoSBiLab Graph can import and export data in a variety of formats, among which the reaction network generated by the beta WorkBench.
Category: Multimedia & Design / Multimedia App's
Publisher: CoSBi, License: Freeware, Price: USD $0.00, File Size: 3.1 MB
Platform: Windows
Matrixer is a piece of software especially suited for teaching econometrics and doing medium-scale applied research. It is small (in physical size, not in capabilities) and has smooth interface.
Main features:
-Linear Regression
-Binomial logit and probit
-Ordered probit
-Censored (tobit) and truncated Regression
-Poisson and negative...
Category: Business & Finance / Applications
Publisher: Alexander Tsyplakov, License: Freeware, Price: USD $0.00, File Size: 1.4 MB
Platform: Windows

Chart java applet software to generate dynamic charts and graphs within JSP, servlets or java applications - bar, line, pie, stacked and grouped charts in 2D and 3D with a wide range of parameters and chart types. Main features: Charts in 2D/3D, Anti aliasing, Multi language support, Cross browser compatible, Java Script parameter control, Data labels, Contextual data drill down, CSV data...
Category: Software Development
Publisher: Swiftchart Limited, License: Demo, Price: USD $99.00, File Size: 97.7 KB
Platform: Windows, Mac, Linux, Unix, MS-DOS, AS/400
Chart java applet software to generate dynamic charts and graphs within JSP, servlets or java applications - bar, line, pie, stacked and grouped charts in 2D and 3D with a wide range of parameters and chart types. Main features: Charts in 2D/3D, Anti aliasing, Multi language support, Cross browser compatible, Java Script parameter control, Data labels, Contextual data drill down, CSV data...
Category: Software Development / Tools & Editors
Publisher: Swiftchart Limited, License: Demo, Price: USD $99.00, File Size: 97.0 KB
Platform: Windows, Mac, Linux, Unix, MS-DOS, AS, 400
DataPlot is a program where you can import your time based data and graph it.
DataPlot is a program where you can import your time based data and Graph it.You can move easily back and forward in user defined time window, allows individual time setting for each Graph, values read directly in Graph by dragging mouse over the curve and much more
Category: Multimedia & Design / Multimedia App's
Publisher: CBIM, License: Freeware, Price: USD $0.00, File Size: 311.0 KB
Platform: Windows