Free Downloads: Scatter Charts
The QI Macros SPC Software for Excel draws pareto Charts, control Charts, histograms, box and whisker plots, Scatter plots and more. There are four "wizards" that figure out what chart or statistic to draw based on your data. Better yet we do it right in Excel. Your just select your data and then select the chart from the QI Macros menu. It also includes over 90...
Category: Business & Finance / MS Office Addons
Publisher: KnowWare International, Inc., License: Shareware, Price: USD $199.00, File Size: 12.7 MB
Platform: Windows
Create stunning 3D bubble Charts in Excel with 5dchart Add-In! 5dchart Add-In for Microsoft Excel is an easy-to-use tool for multi-dimensional data visualization. It allows you to display a 3D bubble chart with two additional parameters: 3D coordinates of each bubble and bubble size and colour. Of course, it is the easy way to create 3D Scatter plot too. 5dchart Add-In is designed...
Category: Business & Finance / MS Office Addons
Publisher: System Approach Ltd., License: Shareware, Price: USD $99.90, File Size: 809.0 KB
Platform: Windows
 Shareware
FusionCharts for Flex is a charting component for Adobe Flex solutions. It helps you create interactive Charts and graphs in your Flex projects. The Charts are powered by FusionCharts v3 framework - the industry leader in Adobe Flash Charting. FusionCharts for Flex offers over 45 chart types spanning both 2D and 3D Charts, including: * Standard Charts like...
Category: Software Development / Components & Libraries
Publisher: InfoSoft Global (P) Ltd., License: Shareware, Price: USD $299.00, ALL1499, File Size: 14.5 MB
Platform: Windows, Mac, Linux, Unix
MindFusion.Charting.WebForms provides applications targeting the .NET platform the ability to create and display various kinds of Charts. The component supports bar, pie, doughnut, Scatter, bubble, line, area, radar and polar Charts. Many features of MindFusion.Charting.WebForms output can be customized in a way that suits your project best. Charts can have different...
Category: Software Development / Misc. Programming
Publisher: MindFusion, License: Demo, Price: USD $0.00, File Size: 5.0 MB
Platform: Windows
JFreeChart is a free Java class library for generating Charts (GNU LGPL). Support is included for: pie Charts, bar Charts, line Charts, Scatter plots, time series Charts, candlestick Charts, high-low-open-close Charts and more. Use in applications, servlets, JSP or applets. Export to PNG, JPEG, PDF, SVG and HTML image maps. Complete...
Category: Software Development
Publisher: Object Refinery Limited, License: Freeware, Price: USD $0.00, File Size: 5.3 MB
Platform: Windows, Linux, Unix
Commercial
Charting tool for the rapid design of 13 different chart types, including bar, dot, horizontal bar, line, pie, donut, Scatter, xy, area, histogram, error bar, bubble, gantt and volume Charts. Additional features include 3D, multiple datasets, gradients, transparency, unlimited annotations, and smoothing. Can be exported to files of types BMP, GIF, PNG, PS, PDF, EMF, JPG, SVG....
Category: Business & Finance / Applications
Publisher: Creative-PC, License: Commercial, Price: USD $49.00, File Size: 7.6 MB
Platform: Windows
Shareware
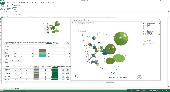
BAT Desktop is a Business Intelligense software for data visualization and OLAP reporting. You can analyze your data by building pivot tables, Charts, treemaps, Scatter diagrams, filtering/sorting/searching for patterns, etc. Product features: - Reports are generated quickly on a vast amount of data; - You can easily perform ad-hoc reporting on your own without bringing...
Category: Business & Finance / Applications
Publisher: BIT Impulse, License: Shareware, Price: USD $149.00, File Size: 28.7 MB
Platform: Windows
AnyChart is a robust and superfast JavaScript charting library to add great-looking, interactive HTML5 Charts into any project, in any browser, and on any platform/OS including mobile ones. AnyChart provides advanced customization and flexibility opportunities, no matter if you are developing a website, a business intelligence application (BI) for corporate usage, or some software for...
Category: Web Authoring / JavaScript
Publisher: AnyChart JavaScript Charts, License: Shareware, Price: USD $49.00, File Size: 17.8 MB
Platform: Windows, Mac, Linux,
Aspose.Chart is a .Net charting component. With it, you can: ceeate more than 20 basic Charts types including Area, Bar, Bubble, Contour, Candlestick, Cube, Curve, CurveArea, Doughnut, Gantt, HighLowClose, Line, OpenHighLowClose, Pareto, Pie, Pyramid, Point, Radar, Scatter, Step, Surface, etc; Create Charts with effects including 3D, frame border, anti-alias, transparency,...
Category: Software Development / Components & Libraries
Publisher: Aspose Pty Ltd, License: Shareware, Price: USD $249.00, File Size: 1.1 MB
Platform: Windows
Shareware
XML Flash Charts are easy to make using Animated Chart Pro. Create dynamic web chart with live data permanently updated from XML source. Animated Chart Pro edition generates real time web Charts using dynamic data and all you have to do is to customize chart appearance, get the result and embed an interactive dynamic flash chart into your Web page. Flash skills is not required!...
Category: Web Authoring / Website Animation Tools
Publisher: Flarium, License: Shareware, Price: USD $69.00, File Size: 2.7 MB
Platform: Windows
Grapher is the ultimate technical graphing package available.
Grapher is the ultimate technical graphing package available.
Choose from several specialty graph types, including ternary, box-whisker, bubble plots, pie Charts, and hi-low-close plots.
Wow your audience every time they see your graphs. Create one of 54 unique graph types.
This easy-to-use, powerful, dynamic program will help you create superior...
Category: Multimedia & Design / Multimedia App's
Publisher: Golden Software, License: Shareware, Price: USD $0.00, File Size: 34.0 MB
Platform: Windows
ChartDirector is a powerful charting component for creating professional and clickable Charts for ASP.NET and Windows Forms applications. It's unique layering architecture enables you to synthesize the Charts you want using standard chart layers. ChartDirector's comprehensive chart styles include pie, donut, bar, line, spline, step line, trend line, curve-fitting, inter-line...
Category: Software Development / Components & Libraries
Publisher: Advanced Software Engineering Ltd, License: Shareware, Price: USD $99.00, File Size: 6.4 MB
Platform: Windows
FigSys is a program for processing, analyzing and presenting data and creating science documents of all kinds. FigSys is a major advance in Windows graphics software. It is powerful but easily accessible to users of all levels of experience. Turning your data into basic figure types such as line graphs, bar Charts, areagrams, drop-plots or Scatter diagrams is completely automatic...
Category: Business & Finance / Applications
Publisher: Biosoft, License: Shareware, Price: USD $300.00, File Size: 8.4 MB
Platform: Windows
ActiveX/OCX control to draw 2D pie Charts, bar Charts & line graphs. As well as displaying the graphs they can be exported to file in gif, png, bmp, jpg or pcx format. Output can be exported as binary data for use with web applications, or copied to the clipboard. A comprehensive selection of properties allow control over colours, fonts, formatting and layout. Pie and bar...
Category: Software Development
Publisher: Chestysoft, License: Demo, Price: USD $60.00, File Size: 976.3 KB
Platform: Windows
All charts are displayed in one window.
All Charts are displayed in one window. User may compare different Charts of one stock or Charts of different stocks easily.
- Advanced indicators: EquiVolume, Point & Figure, GMMA, Heiken-Ashi, Volatility Stop Loss.
Point & Figure Charts consist of columns of X's and O's that represent filtered price movements over time. It is...
Category: Multimedia & Design / Multimedia App's
Publisher: Stock-Anal, License: Shareware, Price: USD $0.00, File Size: 0
Platform: Windows
Chart java applet software to generate dynamic Charts and graphs - bar, line, pie, stacked and grouped Charts in 2D and 3D with a wide range of parameters and chart types. Main features: Charts in 2D/3D, Anti aliasing, Multi language support, Cross browser compatible, Java Script parameter control, Data labels, Contextual data drill down, CSV data sources, Trend...
Category: Software Development / Tools & Editors
Publisher: Swiftchart Limited, License: Demo, Price: USD $99.00, File Size: 97.0 KB
Platform: Windows, Mac, Linux, Unix, MS-DOS, AS, 400
Tool to easily follow the stock market using Point and Figure charts.
Tool to easily follow the stock market using Point and Figure Charts. Get a set of updated Charts everyday in your mailbox (or if you prefer download the Charts files from our website) We have Charts of the following markets: US US mutual funds, ETF's and iShares Canada United Kingdom Europe Australia Select stocks in minutes with our 'Buy the Winner' view! Comes...
Category: Business & Finance / Applications
Publisher: Magic Potion, License: Demo, Price: USD $49.00, File Size: 7.6 MB
Platform: Windows,

Chart java applet software to generate dynamic Charts and graphs - bar, line, pie, stacked and grouped Charts in 2D and 3D with a wide range of parameters and chart types. Main features: Charts in 2D/3D, Anti aliasing, Multi language support, Cross browser compatible, Java Script parameter control, Data labels, Contextual data drill down, CSV data sources, Trend...
Category: Multimedia & Design
Publisher: Swiftchart Limited, License: Demo, Price: USD $99.00, File Size: 97.7 KB
Platform: Windows, Mac, Linux, Unix, MS-DOS, AS/400
Chart java applet software to generate dynamic Charts and graphs within JSP, servlets or java applications - bar, line, pie, stacked and grouped Charts in 2D and 3D with a wide range of parameters and chart types. Main features: Charts in 2D/3D, Anti aliasing, Multi language support, Cross browser compatible, Java Script parameter control, Data labels, Contextual data drill...
Category: Software Development / Tools & Editors
Publisher: Swiftchart Limited, License: Demo, Price: USD $99.00, File Size: 97.0 KB
Platform: Windows, Mac, Linux, Unix, MS-DOS, AS, 400

Chart java applet software to generate dynamic Charts and graphs within JSP, servlets or java applications - bar, line, pie, stacked and grouped Charts in 2D and 3D with a wide range of parameters and chart types. Main features: Charts in 2D/3D, Anti aliasing, Multi language support, Cross browser compatible, Java Script parameter control, Data labels, Contextual data drill...
Category: Software Development
Publisher: Swiftchart Limited, License: Demo, Price: USD $99.00, File Size: 97.7 KB
Platform: Windows, Mac, Linux, Unix, MS-DOS, AS/400
Rapid Charts provides the tools you need to help make creating Charts and graphs for use in web sites or applications as straightforward as possible. Chart definitions allow you to easily save the chart for later use, save the definition to a shared database to share the chart with others or for use in a web page. Charts can be saved to a jpg or png file for inclusion in...
Category: Audio / Utilities & Plug-Ins
Publisher: LLamedos Software, License: Shareware, Price: USD $14.95, File Size: 4.2 MB
Platform: Windows
Chart Trainer -Learn to read nautical charts like an expert.
Chart Trainer -Learn to read nautical Charts like an expert.
Chart Trainer is designed to help mariners interpret nautical Charts and use them more efficiently, both traditional paper Charts and new digital Charts for computers. The materials cover all aspects of nautical Charts in the most detail available, including tutorials on chart reading and...
Category: Home & Education / Teaching Tools
Publisher: Starpath School of Navigation, License: Shareware, Price: USD $39.00, File Size: 39.8 MB
Platform: Windows
Shareware
Super 2d/3d Graph Library is a customizable and powerful, yet light, .NET libray for drawing eye-candy Charts and/or export them into PDF format, vector (Scalable Vector Graphics or SVG) and raster graphics file formats such as JPG, GIF, PNG, BMP, ... Same component may be used in WinForms or ASP.NET applications. Powerful features such as high resolution render, additional calculations,...
Category: Software Development / Components & Libraries
Publisher: Software Siglo XXI, License: Shareware, Price: USD $129.00, EUR99, File Size: 1.2 MB
Platform: Windows
User can paint individual lines by dragging the cursor over lines and identify data interactively.
User can paint individual lines by dragging the cursor over lines and identify data interactively.
In this version of Data Paint you have interactive Rotating Scatter Plot, Simple Scatter Plot, Bar Chart, Star Plot and Parallel Coordinate Plot.
This software can be customized for a specific need.
Category: Business & Finance / Business Finance
Publisher: Man Machine Interface, Inc, License: Freeware, Price: USD $0.00, File Size: 2.4 MB
Platform: Windows
Experience the full flavor of Vegas by downloading TrickorTreat by GDMmedia.
Experience the full flavor of Vegas by downloading TrickorTreat by GDMmedia.com. Modeled from actual Vegas video reels, Trick or Treat offers an exhilarating gaming experience. Set your spook-o-meter to freak out mode, and prepare to be scared rich. Comes complete with fifteen pay lines, Scatter pays, wild symbols, and a Scatter triggered bonus screen. Enter the bonus round and...
Category: Games / Cards, Casino, Lottery
Publisher: Griffith Digital Multimedia, License: Shareware, Price: USD $22.50, File Size: 8.3 MB
Platform: Windows