Free Downloads: Statistical Graph Programs

TeeChart VCL/FMX charting library provides entire featureset to create charts, maps and gauges in 2D, 3D for data visualization; 60+ chart styles and 50+ financial and Statistical indicators. It supports Embarcadero Windows IDEs (RAD Studio, Delphi, C++ Builder) and includes native code FireMonkey support enabling to compile applications for Windows, Mac OS, iOS/iPhone, Android. The...
Category: Software Development / Components: Delphi
Publisher: Steema Software, License: Shareware, Price: USD $479.00, File Size: 20.4 MB
Platform: Windows
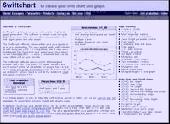
Chart java applet software to generate dynamic charts and graphs within JSP, servlets or java applications - bar, line, pie, stacked and grouped charts in 2D and 3D with a wide range of parameters and chart types. Main features: Charts in 2D/3D, Anti aliasing, Multi language support, Cross browser compatible, Java Script parameter control, Data labels, Contextual data drill down, CSV data...
Category: Software Development
Publisher: Swiftchart Limited, License: Demo, Price: USD $99.00, File Size: 97.7 KB
Platform: Windows, Mac, Linux, Unix, MS-DOS, AS/400
Chart java applet software to generate dynamic charts and graphs within JSP, servlets or java applications - bar, line, pie, stacked and grouped charts in 2D and 3D with a wide range of parameters and chart types. Main features: Charts in 2D/3D, Anti aliasing, Multi language support, Cross browser compatible, Java Script parameter control, Data labels, Contextual data drill down, CSV data...
Category: Software Development / Tools & Editors
Publisher: Swiftchart Limited, License: Demo, Price: USD $99.00, File Size: 97.0 KB
Platform: Windows, Mac, Linux, Unix, MS-DOS, AS, 400
DataPlot is a program where you can import your time based data and graph it.
DataPlot is a program where you can import your time based data and Graph it.You can move easily back and forward in user defined time window, allows individual time setting for each Graph, values read directly in Graph by dragging mouse over the curve and much more
Category: Multimedia & Design / Multimedia App's
Publisher: CBIM, License: Freeware, Price: USD $0.00, File Size: 311.0 KB
Platform: Windows
InVivoStat is a powerful, free to use, Statistical software package which uses R as its statistics engine. It is designed specifically for scientists conducting animal experiments. The package combines complex and powerful Statistical tools (within R) with a user interface that is both easy to use and intuitive to the non-statistician.
While no package can comment on...
Category: Business & Finance / Applications
Publisher: InVivoStat, License: Freeware, Price: USD $0.00, File Size: 25.8 MB
Platform: Windows
ImageApp is a program that involves a lot of principles from machine vision.
ImageApp is a program that involves a lot of principles from machine vision. A GUI that allows you to build up an image processing Graph. An image processing Graph is essentially a sequence of algorithms that do something to images. You can imagine the Graph as the algorithms being the nodes and the flow-of-->data between the algorithms being the arcs.
For...
Category: Multimedia & Design / Multimedia App's
Publisher: Laurence Smith, License: Shareware, Price: USD $0.00, File Size: 0
Platform: Windows
 Shareware
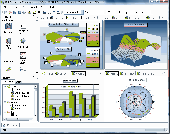
DataScene is a data graphing, animation, and analysis software package. It allows the user to easily plot 2D & 3D graphs (Area, Bar, Pie, Line, Surface, Ploar, and more) with scientific, financial, and Statistical data, to manipulate, print, and export high quality graphs, to analyze data with various mathematical methods (fitting curves, calculating statics, FFT, and more), to create...
Category: Multimedia & Design / Authoring Tools
Publisher: CyberWit, Inc., License: Shareware, Price: USD $219.00, File Size: 44.1 MB
Platform: Windows
QualStat is a statistical data analysis tool.
QualStat is a Statistical data analysis tool. It is the first Statistical software package designed for multivariate data analysis. It can be used by engineers, researchers, quality control professionals and statisticians to provide information about the data from their processes.
Category: Business & Finance / Vertical Markets
Publisher: InControl Technologies, Inc., License: Shareware, Price: USD $675.00, File Size: 6.0 MB
Platform: Windows
The WebViewer plug-in enables Windows users whether or not they have SigmaPlot to explore the data used to create the Graph.
Using the WebViewer plug-in with your Web browser window you can:
- View the data used to create the Graph
- Print a Graph in a web document at full resolution
- Zoom in and out of a Graph
- Grab and...
Category: Multimedia & Design / Graphics Viewers
Publisher: SYSTAT Software Inc., License: Freeware, Price: USD $0.00, File Size: 12.6 MB
Platform: Windows
ProcessMA is a Statistical Analysis tool.
ProcessMA is a Statistical Analysis tool. It has different features like Graphical Analysis, Regression, Measurement System Analysis, Capability Analysis, Design of Experiments, Statistical Process Control, Reliability & Survival Analysis, Process Analysis and Project Management.
Category: Business & Finance / Applications
Publisher: Process Excellence, License: Shareware, Price: USD $295.00, File Size: 6.6 MB
Platform: Windows
This add-in adds powerful yet easy-to-use statistical analysis features.
This add-in adds powerful yet easy-to-use Statistical analysis features. From within Excel you will be able to access many Statistical tools including Control Charts, Cpk analysis, Histograms, Pareto Diagrams, MSA, Regression, Hypothesis Testing, and much more.
Category: Business & Finance / MS Office Addons
Publisher: SigmaZone, License: Shareware, Price: USD $249.00, File Size: 12.5 MB
Platform: Windows
TeeChart ActiveX includes 60+ Chart types in 2D, 3D to visualize data. From the common Line, Bar, Area, Pie chart to the field-specific charts like Candle OHLC, Point and Figure, Volume, High-Low,BoxPlot,etc It provides a large selection Financial and Statistical Indicators that perform calculations ranging from basic mean; Mode Function, Median Function to the more complex...
Category: Software Development / Components & Libraries
Publisher: Steema Software, License: Shareware, Price: USD $469.00, File Size: 52.3 MB
Platform: Windows
Visual Stats is a statistics program to implement data analysis and multivariate Statistical analysis.
The program features and easy-to-use Excel-like data editor. Probability, enables you to compute and Graph probability density function values, cumulative distribution function values, survival function values, hazard function values, quantile values, means and variances....
Category: Business & Finance / Applications
Publisher: GraphNow Software, License: Shareware, Price: USD $120.00, File Size: 2.6 MB
Platform: Windows
SYSTAT is a versatile and comprehensive statistical software package.
SYSTAT is a versatile and comprehensive Statistical software package. It employs a staggering range of powerful techniques to help conduct many types of research.
Novice Statistical users can use SYSTAT’s menu-driven interface to conduct simple analyses and produce beautiful 2D and 3D graphics for presentations or reports.
Category: Home & Education / Mathematics
Publisher: SYSTAT Software, Inc., License: Shareware, Price: USD $1274.15, File Size: 147.0 MB
Platform: Windows
With The Option Strategy Builder you could pick up an option and place it directly to the return Graph. As with the online tool, just drag and drop the option on the Graph, and build your strategy. Using your mouse, the options can be easily moved on the Graph to different strike prices, and to different expiration dates.
With this program you can manage your...
Category: Multimedia & Design / Multimedia App's
Publisher: SamoaSky, License: Freeware, Price: USD $0.00, File Size: 3.1 MB
Platform: Windows
Fast Statistics is a statistical analysis program for Microsoft Excel.
Fast Statistics is a Statistical analysis program for Microsoft Excel. It is can be used as an add-on for it and also it can be installed as a stand-alone application, so there is no need to have MS-Excel installed. It can complete different tasks from manipulations of basic data up to the advanced Statistical analysis to produce sophisticated reports and charts. This tool is...
Category: Business & Finance / MS Office Addons
Publisher: Fatesoft.com, License: Shareware, Price: USD $49.95, File Size: 3.6 MB
Platform: Windows

Audio Graph ActiveX is an ActiveX (OCX) component for software developers. With this ActiveX component you can display a meter, detect a silence, and display 2 types of audio graphs by the WaveIn/WaveOut buffers. Just send a pointer of the buffers array to the component then operate the Display function, the component will do the rest on the Graph view. You can set the...
Category: Software Development
Publisher: expresslib.com, License: Shareware, Price: USD $69.00, File Size: 806.5 KB
Platform: Windows
This software adds a ribbon to excel with a number of statistical buttons.
This software adds a ribbon to excel with a number of Statistical buttons.This is not intended to be a full Statistical analysis package, but only a source for quick visualizations and calculations. Is very easy to install and to use with any type of Microsoft Excel.
Category: Utilities / Misc. Utilities
Publisher: Roger Pharr, License: Freeware, Price: USD $0.00, File Size: 6.0 MB
Platform: Windows
Excel Graph Multiple Equations Software is an application that allows you to plot multiple functions in Microsoft Excel. It is able to create multiple charts based on the formulas entered. You can enter an equation manually or load multiple equations from a text file (.txt). The application is able to plot each equation on an individual Graph or all the equations on a single...
Category: Business & Finance / MS Office Addons
Publisher: Sobolsoft, License: Shareware, Price: USD $19.99, File Size: 2.5 MB
Platform: Windows
New Features of DataStudio:
- Video Player and Synchronization -- Play a movie or synch a movie to experimental data
- Presentation Style Graph -- Additional Graph style that moves measurements and units outside the Graph; ideal for publication of DataStudio graphs in educational journals
- Predictive Sketching -- Students can draw directly on the...
Category: Home & Education / Miscellaneous
Publisher: PASCO, License: Demo, Price: USD $0.00, File Size: 32.8 MB
Platform: Windows

Archim is a program for drawing the graphs of all kinds of functions. You can define a Graph explicitly and parametrically, in polar and spherical coordinates, on a plane and in space (surface). Archim will be useful for teachers and students, as well as for everyone who is interested min geometry. With Archim, you will draw the Graph of any function and form, just use your...
Category: Home & Education
Publisher: Stochastic Lab, License: Freeware, Price: USD $0.00, File Size: 479.6 KB
Platform: Windows
Graph-A-Ping allows you to visually see the ping latency between ping times.
Graph-A-Ping allows you to visually see the ping latency between ping times. The bigger the gap between one ping to another allows you to spot possible network bottle neck.
This tool is actually an applet part of Glass Net Networks monitoring console.
Category: Internet / Misc. Plugins
Publisher: Mataluis.Com, License: Freeware, Price: USD $0.00, File Size: 2.1 MB
Platform: Windows
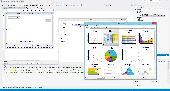
UNISTAT is a comprehensive Statistical software package featuring a best-in-class statistics add-in for Excel data analysis, charting and presentation-quality reporting.
Highly regarded by scientists and academics since its release in 1984 as the first commercial Statistical software for personal computers, UNISTAT is today considered a must-have by organizations...
Category: Business & Finance / MS Office Addons
Publisher: Unistat Ltd, License: Shareware, Price: USD $300.00, File Size: 12.8 MB
Platform: Windows
Graph FAWM is a function graphing tool that is easy for teachers and students to use.
Graph FAWM is a function graphing tool that is easy for teachers and students to use. A wealth of information is available about any Graph just by moving the mouse pointer to a point of interest.
Category: Business & Finance / Applications
Main Features:
- True algebraic equation format
- Implicit equations
- Locates intercepts, turning points and points of intersection
Publisher: New FAWM Creations, License: Shareware, Price: USD $20.00, File Size: 4.6 MB
Platform: Windows
XYZ Data Viewer is a Excel table to 3-D graph converter.
XYZ Data Viewer is a Excel table to 3-D Graph converter. It provide easy way to analyze a variety of tabular data from Microsoft Excel in the view of 3-dimensions Graph. With this tool You can view and examine your data as a three-dimensional object in three-dimensional space, by manipulate the 3d object on the program screen. You can save this 3d Graph as a file and upload...
Category: Multimedia & Design / Media Management
Publisher: 3 Fish Software, License: Shareware, Price: USD $69.95, File Size: 9.1 MB
Platform: Windows