Free Downloads: Tb Graphs Charts Information
RM Starting Graph is an easy-to-use graphing package that provides younger pupils with the ideal introduction to Information handling.
This much loved software is now compatible with Windows Vista as well as having a version for Community Connect 4.
RM Starting Graph has been developed with the user in mind, and is ideal for developing initial numeracy and data...
Category: Home & Education / Teaching Tools
Publisher: Research Machines plc., License: Shareware, Price: USD $0.00, File Size: 0
Platform: Windows
 Freeware
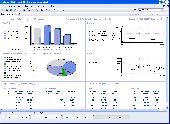
MyOra is a free SQL Tool for Oracle database developers and DBAs. This tool is simple, fast and easy to use, requires no installation, no Oracle client and no internet connection. Just download, unzip and start using with a click of the mouse, run SQL queries and Monitor database performance in Real Time. MyOraâs MDI (Multi Document Interface) framework handles multiple sub-windows opened at...
Category: Software Development / Databases & Networks
Publisher: Jayam Systems, LLC, License: Freeware, Price: USD $0.00, File Size: 1.0 MB
Platform: Windows
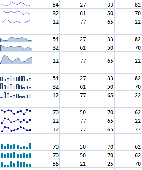
TinyGraphs is an open source Excel add-in that creates sparklines, mini column Graphs, and area Graphs from a row of data. It generates beautiful tiny graphics that are as small as a cell and can be placed next to the items that they describe. The tiny graphics, or sparklines, are as tall as the text around them and are useful for visualizing large quantities of data, such as...
Category: Business & Finance / Spreadsheets
Publisher: ConnectCode Pte Ltd, License: Freeware, Price: USD $0.00, File Size: 344.0 KB
Platform: Windows
Fast Statistics is a statistical analysis program for Microsoft Excel.
Fast Statistics is a statistical analysis program for Microsoft Excel. It is can be used as an add-on for it and also it can be installed as a stand-alone application, so there is no need to have MS-Excel installed. It can complete different tasks from manipulations of basic data up to the advanced statistical analysis to produce sophisticated reports and Charts. This tool is perfect for...
Category: Business & Finance / MS Office Addons
Publisher: Fatesoft.com, License: Shareware, Price: USD $49.95, File Size: 3.6 MB
Platform: Windows
Bytescout Graph Digitizer Scout is a handy and useful application that provides users with several functions. This program allows you to convert hard copy Graphs, plots and Charts. This efficient software enables you to digitize Graphs, Charts and plots using automated methods such as luminosity recognition and color recognition. The program works almost...
Category: Multimedia & Design / Multimedia App's
Publisher: ByteScout, License: Shareware, Price: USD $34.45, File Size: 5.2 MB
Platform: Windows
Mangodata is a powerful yet easy to use multi-user database for education.
Mangodata is a powerful yet easy to use multi-user database for education. It allows pupils to easily create a database, enter Information and then search the data to display results through a range of Graphs.
This Information might include a class survey, historical census Information or perhaps the results of a scientific investigation. There is a...
Category: Home & Education / Miscellaneous
Publisher: MightyMango, License: Shareware, Price: USD $0.00, File Size: 0
Platform: Windows
The big kahuna. It's got everything. All the functionality of Shaft Selector (SS) and Tapes And Charts (TAC), plus four additional tabs that cover ballistics Charts and Graphs, target simulation scenarios, how to accurately estimate unmarked distances, and access to some of the important system variables.
Requirements:
- Windows...
Category: Games / Simulations
Publisher: Pinwheel Software, Inc, License: Shareware, Price: USD $0.00, File Size: 0
Platform: Windows
XF Rendering Server family of products can automate the creation of electronic documents like technical manuals, brochures, catalogues and marketing materials, invoices, statements and business reports containing Charts and Graphs, by dynamically generating them from any datasource including XML, databases, Web Services and more. Documents can be generated in both on-demand and in...
Category: Business & Finance / Business Finance
Publisher: Ecrion Software Inc., License: Shareware, Price: USD $0.00, File Size: 50.9 MB
Platform: Windows
UNaSCANaIT digitizer software works with most image formats (TIFF, JPG, BMP, GIF, etc.
UNaSCANaIT digitizer software works with most image formats (TIFF, JPG, BMP, GIF, etc.) from any scanner, digital camera, or other image source to digitize plots, strip Charts, instrumental output, old Graphs, published Graphs, etc. In addition to the many graph digitizing features, UNaSCANaIT also integrates peak areas, smoothes data, takes derivatives, reascales...
Category: Multimedia & Design / Multimedia App's
Publisher: Silk Scientific, Inc., License: Shareware, Price: USD $445.00, File Size: 12.7 MB
Platform: Windows
Chart java applet software to generate dynamic Charts and Graphs - bar, line, pie, stacked and grouped Charts in 2D and 3D with a wide range of parameters and chart types. Main features: Charts in 2D/3D, Anti aliasing, Multi language support, Cross browser compatible, Java Script parameter control, Data labels, Contextual data drill down, CSV data sources, Trend...
Category: Software Development / Tools & Editors
Publisher: Swiftchart Limited, License: Demo, Price: USD $99.00, File Size: 97.0 KB
Platform: Windows, Mac, Linux, Unix, MS-DOS, AS, 400
Demo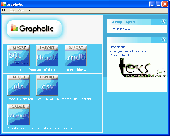
Imagine a complete Graphing solution assisting you right from importing data and manipulating data, plotting Graphs, customizing looks, saving and exporting your Graphs as high quality images and producing dynamic reports of your data in a matter of a few easy steps. Features: Data Import: Connects effortlessly with your MS SQL Server, Oracle, Access, XLS and CSV files...
Category: Software Development / Databases & Networks
Publisher: Teknowledge LLC, License: Demo, Price: USD $99.00, File Size: 8.1 MB
Platform: Windows
ESBStats is a mathematical and statistical software package, which is designed to meet the analytical needs of students, teachers and corporate users. It provides you with many statistical procedures and routines like Deciles, Grand Mean, Quartiles, Standard Deviation, Residuals, Geometric Mean, Hypothesis Analysis, Linear Regression Analysis, Multiple Regression Analysis and many more....
Category: Business & Finance / Applications
Publisher: ESB Consultancy, License: Shareware, Price: USD $79.00, File Size: 6.6 MB
Platform: Windows
OfficeReports Link links data from Excel ranges to native PowerPoint tables, Charts and shapes. This can be done in such a way, so backgroundcolors from Excel cells are shown as logos and icons in PowerPoint. The Excel ranges can have a variable number of rows and/or columns, and OfficeReports is integrated with Excels and PowerPoints Macro engine. Microsoft Office already contains...
Category: Business & Finance / Business Finance
Publisher: OfficeReports, License: Shareware, Price: USD $39.00, File Size: 609.0 KB
Platform: Windows
XF Rendering Server family of products can automate the creation of electronic documents like technical manuals, brochures, catalogues and marketing materials, invoices, statements and business reports containing Charts and Graphs, by dynamically generating them from any datasource including XML, databases, Web Services and more. Documents can be generated in both on-demand and in...
Category: Multimedia & Design / Multimedia App's
Publisher: Ecrion Software Inc., License: Shareware, Price: USD $0.00, File Size: 52.4 MB
Platform: Windows

Chart java applet software to generate dynamic Charts and Graphs - bar, line, pie, stacked and grouped Charts in 2D and 3D with a wide range of parameters and chart types. Main features: Charts in 2D/3D, Anti aliasing, Multi language support, Cross browser compatible, Java Script parameter control, Data labels, Contextual data drill down, CSV data sources, Trend...
Category: Multimedia & Design
Publisher: Swiftchart Limited, License: Demo, Price: USD $99.00, File Size: 97.7 KB
Platform: Windows, Mac, Linux, Unix, MS-DOS, AS/400
Drawing graphs without the right tool is simply difficult.
Drawing Graphs without the right tool is simply difficult. uDraw(Graph) automates this task for you. Find out how uDraw(Graph) creates your flow Charts, diagrams, hierarchies or structure visualizations using automatic layout - much faster than with any standard drawing program. With the API, uDraw(Graph) can even be embedded in your own programs as a visualization component.
Category: Multimedia & Design / Image Editing
Publisher: University Bremen, FB3, Germany, License: Freeware, Price: USD $0.00, File Size: 2.6 MB
Platform: Windows
Budget Master is a free personal budgeting program.
Budget Master is a free personal budgeting program. You can use it to budget your personal finances and track your spendings. The program has Graphs and reports to give you a visual representation of your budget. The program simply allows you to enter your paycheck Information for each month. You can create categories and budget spendings for each of those categories. The program...
Category: Business & Finance / Personal Finance
Publisher: Brad Wall, License: Freeware, Price: USD $0.00, File Size: 4.6 MB
Platform: Windows
Chart java applet software to generate dynamic Charts and Graphs within JSP, servlets or java applications - bar, line, pie, stacked and grouped Charts in 2D and 3D with a wide range of parameters and chart types. Main features: Charts in 2D/3D, Anti aliasing, Multi language support, Cross browser compatible, Java Script parameter control, Data labels, Contextual...
Category: Software Development / Tools & Editors
Publisher: Swiftchart Limited, License: Demo, Price: USD $99.00, File Size: 97.0 KB
Platform: Windows, Mac, Linux, Unix, MS-DOS, AS, 400

Chart java applet software to generate dynamic Charts and Graphs within JSP, servlets or java applications - bar, line, pie, stacked and grouped Charts in 2D and 3D with a wide range of parameters and chart types. Main features: Charts in 2D/3D, Anti aliasing, Multi language support, Cross browser compatible, Java Script parameter control, Data labels, Contextual...
Category: Software Development
Publisher: Swiftchart Limited, License: Demo, Price: USD $99.00, File Size: 97.7 KB
Platform: Windows, Mac, Linux, Unix, MS-DOS, AS/400
Science Teacher Helper is an add-on for Microsoft Word, it was designed with a single purpose in mind - to save you time when editing Graphs and Charts of math, chemistry and physics in documents. You can easily add 765 functions, Graphs and Charts of physical, chemical and math into your MS WORD document.
Science Teacher Helper offers the user a wide rage of...
Category: Business & Finance / Applications
Publisher: helpscience Inc, License: Shareware, Price: USD $39.95, File Size: 743.0 KB
Platform: Windows
All charts are displayed in one window.
All Charts are displayed in one window. User may compare different Charts of one stock or Charts of different stocks easily.
- Advanced indicators: EquiVolume, Point & Figure, GMMA, Heiken-Ashi, Volatility Stop Loss.
Point & Figure Charts consist of columns of X's and O's that represent filtered price movements over time. It is...
Category: Multimedia & Design / Multimedia App's
Publisher: Stock-Anal, License: Shareware, Price: USD $0.00, File Size: 0
Platform: Windows
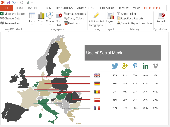
Tool to easily follow the stock market using Point and Figure charts.
Tool to easily follow the stock market using Point and Figure Charts. Get a set of updated Charts everyday in your mailbox (or if you prefer download the Charts files from our website) We have Charts of the following markets: US US mutual funds, ETF's and iShares Canada United Kingdom Europe Australia Select stocks in minutes with our 'Buy the Winner' view! Comes...
Category: Business & Finance / Applications
Publisher: Magic Potion, License: Demo, Price: USD $49.00, File Size: 7.6 MB
Platform: Windows,
DecisionEdge provides the Charts managers need to understand and share key Information about their projects. By clicking a toolbar button in Microsoft Office Project, managers can quickly access over 100 new Charts and reports that help them plan resource allocation, keep stakeholders informed, combine and compare projects, track project status, and measure project...
Category: Business & Finance / Project Management
Publisher: DecisionEdge, Inc., License: Commercial, Price: USD $299.00, File Size: 41.7 MB
Platform: Windows
Fast, Powerful and Flexible, E-Tabs Enterprise automates the production of Charts, Graphs, and summary reports directly from your research data. Automating your reporting with Enterprise ensures accuracy and saves time because manual tasks that leave room for error such as hand entry or tools offering only partial automation are no longer necessary.Any researcher will be aware of...
Category: Audio / Utilities & Plug-Ins
Publisher: E-Tabs, License: Demo, Price: USD $0.00, File Size: 139.1 KB
Platform: Windows
HanengCharts enables you to easily add customized, dynamic, interactive Charts to your Web site, intranet or Web application. No installation is required on the server, simply upload the small JAR file (80Kb) to the same folder as your Web page, add a few lines of HTML code and you have your first chart. Use any technology that can output HTML (like ASP.Net, ASP, PHP, JSP, ColdFusion...
Category: Internet
Publisher: Haneng Consult, License: Demo, Price: USD $399.00, File Size: 1.0 MB
Platform: Windows, Mac, Linux, Unix