Free Downloads: Visualization Graph
AVS/Express is a comprehensive and versatile data Visualization tool for both non-programmers and experienced developers. Rapid data analysis and rich Visualization techniques combined with an intuitive, graphical application development environment make AVS/Express the best choice for any data Visualization task.
AVS/Express provides powerful...
Category: Business & Finance / MS Office Addons
Publisher: Advanced Visual Systems, License: Shareware, Price: USD $0.00, File Size: 0
Platform: Windows
 Shareware
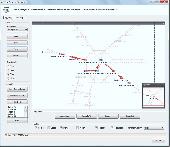
SusaninLab aimed at solving and visualizing such tasks as classic travelling salesman problem (TSP) and searching the shortest path between several nodes and building the spanning tree with minimal cost. SusaninLab is a package of two ActiveX DLLs ELGraphVisio and ELSusaninPath. ELGraphVisio ActiveX DLL is a window ATL control that allows to render Graph structure. With the help of...
Category: Software Development / ActiveX
Publisher: ELSoft, License: Shareware, Price: USD $95.00, File Size: 1.3 MB
Platform: Windows
TwistedPixel is a Visualization plugin for Windows Media Player that uses the system's graphics card to produce stunning 3D visualizations. On the software front, it uses Microsoft's Direct3D to produce flowing images in reaction to music. The Visualization is very well synchronized with the beats. There are around 100+ presets that come pre installed with this plugin,...
Category: Audio / Utilities & Plug-Ins
Publisher: Brian Spangler, License: Freeware, Price: USD $0.00, File Size: 5.7 MB
Platform: Windows
The educational system for Visualization of the elektric and magnetic field in linear homogeneous environment.
Main properties
- Visualization of the elektric and magnetic field
- Visualization of time varying field (planned)
- Solution of trajectory of charged particles in the field (planned)
- Computation of the integral...
Category: Utilities / Misc. Utilities
Publisher: Ing. Pavel Karban, License: Freeware, Price: USD $0.00, File Size: 1.2 MB
Platform: Windows
Flowchart4C# is a program visualization tool for C#.
Flowchart4C# is a program Visualization tool for C#. It provides flowcharts for C# methods generated from source code. The Control Flow Graph helps us to understand code flow quickly. Alternatively it is used for retro-documentation and program analysis.
Flowchart4C# - is available as an Add-in for VisualStudio.NET IDE, developers have an in-place program...
Category: Software Development / Misc. Programming
Publisher: CodeSWAT, License: Shareware, Price: USD $66.58, File Size: 5.1 MB
Platform: Windows
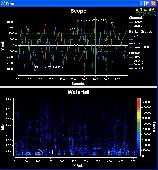
PlotLab is a set of Visual C++ components for very easy and fast Data Visualization. The library includes: Scope - scientific chart component for plotting multi-channel data. Waterfall - data plotting component, especially suitable for FFT results. The components allow zooming, navigation, direct printing, clipboard copy, save to file and more. All of the components are optimized...
Category: Software Development / Components & Libraries
Publisher: Mitov Software, License: Shareware, Price: USD $320.00, File Size: 181.1 MB
Platform: Windows
Shareware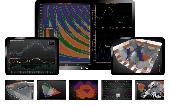
LightningChart Ultimate is the fastest 2D and 3D measurement, engineering, trading, finance and research data Visualization SDK for .NET, WPF and WinForms. LightningChart Ultimate is entirely GPU accelerated (Direct3D) and performance optimized data Visualization control for presenting masses of data in 2D Graph view, 3D view and polar views. It is add-on library to...
Category: Software Development / Components & Libraries
Publisher: Arction Ltd, License: Shareware, Price: USD $590.00, File Size: 1024 B
Platform: Windows
ImageApp is a program that involves a lot of principles from machine vision.
ImageApp is a program that involves a lot of principles from machine vision. A GUI that allows you to build up an image processing Graph. An image processing Graph is essentially a sequence of algorithms that do something to images. You can imagine the Graph as the algorithms being the nodes and the flow-of-->data between the algorithms being the arcs.
For...
Category: Multimedia & Design / Multimedia App's
Publisher: Laurence Smith, License: Shareware, Price: USD $0.00, File Size: 0
Platform: Windows
The WebViewer plug-in enables Windows users whether or not they have SigmaPlot to explore the data used to create the Graph.
Using the WebViewer plug-in with your Web browser window you can:
- View the data used to create the Graph
- Print a Graph in a web document at full resolution
- Zoom in and out of a Graph
- Grab and...
Category: Multimedia & Design / Graphics Viewers
Publisher: SYSTAT Software Inc., License: Freeware, Price: USD $0.00, File Size: 12.6 MB
Platform: Windows
Akuarela is a new data Visualization tool for Ad-Hoc Reporting / Self Service BI that can be used with nearly every available data warehouse. It has been successfully tested with Microsoft Analysis Services and SAP Netweaver BI.
Akuarelas easy-to-use interface allows for the rapid creation of presentation ready reports and interactive dashboards. Next to many other...
Category: Multimedia & Design / Graphics Viewers
Publisher: Christoph Aussem, License: Freeware, Price: USD $0.00, File Size: 1.2 MB
Platform: Windows
With The Option Strategy Builder you could pick up an option and place it directly to the return Graph. As with the online tool, just drag and drop the option on the Graph, and build your strategy. Using your mouse, the options can be easily moved on the Graph to different strike prices, and to different expiration dates.
With this program you can manage your...
Category: Multimedia & Design / Multimedia App's
Publisher: SamoaSky, License: Freeware, Price: USD $0.00, File Size: 3.1 MB
Platform: Windows

Audio Graph ActiveX is an ActiveX (OCX) component for software developers. With this ActiveX component you can display a meter, detect a silence, and display 2 types of audio graphs by the WaveIn/WaveOut buffers. Just send a pointer of the buffers array to the component then operate the Display function, the component will do the rest on the Graph view. You can set the...
Category: Software Development
Publisher: expresslib.com, License: Shareware, Price: USD $69.00, File Size: 806.5 KB
Platform: Windows
Excel Graph Multiple Equations Software is an application that allows you to plot multiple functions in Microsoft Excel. It is able to create multiple charts based on the formulas entered. You can enter an equation manually or load multiple equations from a text file (.txt). The application is able to plot each equation on an individual Graph or all the equations on a single...
Category: Business & Finance / MS Office Addons
Publisher: Sobolsoft, License: Shareware, Price: USD $19.99, File Size: 2.5 MB
Platform: Windows
New Features of DataStudio:
- Video Player and Synchronization -- Play a movie or synch a movie to experimental data
- Presentation Style Graph -- Additional Graph style that moves measurements and units outside the Graph; ideal for publication of DataStudio graphs in educational journals
- Predictive Sketching -- Students can draw directly on the...
Category: Home & Education / Miscellaneous
Publisher: PASCO, License: Demo, Price: USD $0.00, File Size: 32.8 MB
Platform: Windows

Archim is a program for drawing the graphs of all kinds of functions. You can define a Graph explicitly and parametrically, in polar and spherical coordinates, on a plane and in space (surface). Archim will be useful for teachers and students, as well as for everyone who is interested min geometry. With Archim, you will draw the Graph of any function and form, just use your...
Category: Home & Education
Publisher: Stochastic Lab, License: Freeware, Price: USD $0.00, File Size: 479.6 KB
Platform: Windows
Shareware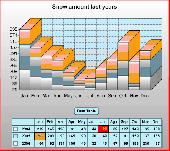
Super 2d/3d Graph Library is a customizable and powerful, yet light, .NET libray for drawing eye-candy charts and/or export them into PDF format, vector (Scalable Vector Graphics or SVG) and raster graphics file formats such as JPG, GIF, PNG, BMP, ... Same component may be used in WinForms or ASP.NET applications. Powerful features such as high resolution render, additional calculations,...
Category: Software Development / Components & Libraries
Publisher: Software Siglo XXI, License: Shareware, Price: USD $129.00, EUR99, File Size: 1.2 MB
Platform: Windows
Graph-A-Ping allows you to visually see the ping latency between ping times.
Graph-A-Ping allows you to visually see the ping latency between ping times. The bigger the gap between one ping to another allows you to spot possible network bottle neck.
This tool is actually an applet part of Glass Net Networks monitoring console.
Category: Internet / Misc. Plugins
Publisher: Mataluis.Com, License: Freeware, Price: USD $0.00, File Size: 2.1 MB
Platform: Windows
NetCharts Designer puts thousands of data Visualization design options right at your fingertips for comprehensive chart, Graph, table, dashboard and scorecard design. Automatic data refresh allows for retrieval from multiple data sources simultaneously for real-time updates. Plus Designer connects to virtually any data source, supports multiple development languages (JSP, ASP,...
Category: Multimedia & Design / Fonts
Publisher: Visual Mining, Inc., License: Freeware, Price: USD $0.00, File Size: 28.9 MB
Platform: Windows
Graph FAWM is a function graphing tool that is easy for teachers and students to use.
Graph FAWM is a function graphing tool that is easy for teachers and students to use. A wealth of information is available about any Graph just by moving the mouse pointer to a point of interest.
Category: Business & Finance / Applications
Main Features:
- True algebraic equation format
- Implicit equations
- Locates intercepts, turning points and points of intersection
Publisher: New FAWM Creations, License: Shareware, Price: USD $20.00, File Size: 4.6 MB
Platform: Windows
XYZ Data Viewer is a Excel table to 3-D graph converter.
XYZ Data Viewer is a Excel table to 3-D Graph converter. It provide easy way to analyze a variety of tabular data from Microsoft Excel in the view of 3-dimensions Graph. With this tool You can view and examine your data as a three-dimensional object in three-dimensional space, by manipulate the 3d object on the program screen. You can save this 3d Graph as a file and upload...
Category: Multimedia & Design / Media Management
Publisher: 3 Fish Software, License: Shareware, Price: USD $69.95, File Size: 9.1 MB
Platform: Windows
The Orbit Visualization Tool (OVT) is a software for Visualization of satellite orbits in the Earth's magnetic field. The program can display satellite orbits in five coordinate systems (GEI, GEO, GSM, SMC, GSE), satellite footprints projected on the Earth's surface and shown in either geographic (GEO) or geomagnetic (SMC) coordinates. In addition to satellite orbits the...
Category: Home & Education / Astrology & Numerology
Publisher: OVT Team, License: Freeware, Price: USD $0.00, File Size: 0
Platform: Windows
dcsDigitiser, a Graph digitizer and densitometer, converts graphs into digital X-Y numerical numbers for peer analysis of graphs and gel in the open literature and/or of your own hard copies. With excellent performance, dcsDigitiser is accurate, precise, versatile and straightforward in its use. It is now only a few clicks to get a numerical reading of graphs of interest while surfing on...
Category: Home & Education / Mathematics
Publisher: J & C Consultation and Technology, License: Shareware, Price: USD $120.00, File Size: 3.8 MB
Platform: Windows
VITASCOPE is an acronym for VIsualizaTion of Simulated Construction OPErations.
VITASCOPE is an acronym for Visualization of Simulated Construction OPErations. VITASCOPE is an open, loosely-coupled, user-extensible 3D animation description language designed specifically for 1) Visualizing simulated construction processes and resulting products in 3D; and 2) Developing higher-level construction Visualization tools.
Category: Multimedia & Design / Graphics Viewers
Publisher: Vineet R. Kamat, License: Freeware, Price: USD $0.00, File Size: 29.6 MB
Platform: Windows
ViewZ is the Visualization Software used by Zeus Numerix for analysis and interpretation of all data generated and for providing services to it's customers. It started off as an in-house development for specific Visualization needs of the company. With the addition of numerous algorithms and tools, it turned in to a stand-alone Visualization Software for viewing data...
Category: Business & Finance / Applications
Publisher: Zeus Numerix, License: Demo, Price: USD $0.00, File Size: 4.9 MB
Platform: Windows
Rapid Design Visualization (RDV) is an application developed specifically for use with Autodesk Civil 3D.
RDV enables any Civil 3D user to create a fully interactive Visualization environment directly from their Civil 3D project. Using RDV for Civil 3D designers can easily create drive through simulations, flyovers and interactive simulations for proposed roads,...
Category: Business & Finance / MS Office Addons
Publisher: RDV Systems, License: Freeware, Price: USD $0.00, File Size: 14.7 MB
Platform: Windows