Free Downloads: Web Line Graph
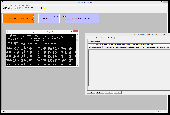
The Datastead Multipurpose Encoder SDK is a DirectShow Sink filter
The Datastead Multipurpose Encoder SDK is a DirectShow Sink filter able to compress or encode audio/video streams by invoking in the background a command-Line transcoder executable, if this executable supports a named pipe as input. A LGPL build of FFmpeg named ffmpegLGPL.exe is included in the filter. The filter multiplexes the uncompressed DirectShow video and audio streams into an...
Category: Software Development / Components & Libraries
Publisher: DATASTEAD Sarl, License: Shareware, Price: USD $950.00, File Size: 13.4 MB
Platform: Windows
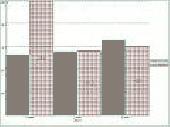
SBHistogram generates simple histograms from simple ASCII data files.
SBHistogram generates simple histograms from simple ASCII data files. It's a simple tool designed to be easy to use.
A histogram is a chart in which data values in counted and placed into buckets. For example, let's assume you want to do a histogram of peoples ages. Then you might want to use buckets such as 1-10 years, 11-20 years, 21-30 years, etc. Each bucket counts the...
Category: Multimedia & Design / Multimedia App's
Publisher: SB-Software, License: Freeware, Price: USD $0.00, File Size: 604.0 KB
Platform: Windows
Insight Graphing allows you to add graphs to your Clarion Windows, or Reports.
Insight Graphing allows you to add graphs to your Clarion Windows, or Reports. But more importantly than just the ability, it also provides a powerful template interface which allows you to Graph data directly out of your files, queues or memory. It also features complete control over the look of your Graph, from the axis settings, to the Graph itself, even the legend. You...
Category: Multimedia & Design / Multimedia App's
Publisher: Capesoft, License: Shareware, Price: USD $349.00, File Size: 968.0 KB
Platform: Windows
Add Powerful reporting features to your Web / Intranet pages and applications. With advanced graphing you will be quickly adding impressive and dynamic charting capabilities bringing your data alive ! The PHP graphing scripts provide a very easy way to embed dynamically generated graphs and charts into PHP applications and HTML Web pages.Very easy to use and add professional...
Category: Software Development
Publisher: Sirius Computer Consultants Limited, License: Shareware, Price: USD $345.00, File Size: 1.5 MB
Platform: Windows, Mac, Linux, OS/2, Unix
With The Option Strategy Builder you could pick up an option and place it directly to the return Graph. As with the online tool, just drag and drop the option on the Graph, and build your strategy. Using your mouse, the options can be easily moved on the Graph to different strike prices, and to different expiration dates.
With this program you can manage your...
Category: Multimedia & Design / Multimedia App's
Publisher: SamoaSky, License: Freeware, Price: USD $0.00, File Size: 3.1 MB
Platform: Windows

Audio Graph ActiveX is an ActiveX (OCX) component for software developers. With this ActiveX component you can display a meter, detect a silence, and display 2 types of audio graphs by the WaveIn/WaveOut buffers. Just send a pointer of the buffers array to the component then operate the Display function, the component will do the rest on the Graph view. You can set the...
Category: Software Development
Publisher: expresslib.com, License: Shareware, Price: USD $69.00, File Size: 806.5 KB
Platform: Windows
Grapher is the ultimate technical graphing package available.
Grapher is the ultimate technical graphing package available.
Choose from several specialty Graph types, including ternary, box-whisker, bubble plots, pie charts, and hi-low-close plots.
Wow your audience every time they see your graphs. Create one of 54 unique Graph types.
This easy-to-use, powerful, dynamic program will help you create...
Category: Multimedia & Design / Multimedia App's
Publisher: Golden Software, License: Shareware, Price: USD $0.00, File Size: 34.0 MB
Platform: Windows
Excel Graph Multiple Equations Software is an application that allows you to plot multiple functions in Microsoft Excel. It is able to create multiple charts based on the formulas entered. You can enter an equation manually or load multiple equations from a text file (.txt). The application is able to plot each equation on an individual Graph or all the equations on a single...
Category: Business & Finance / MS Office Addons
Publisher: Sobolsoft, License: Shareware, Price: USD $19.99, File Size: 2.5 MB
Platform: Windows
New Features of DataStudio:
- Video Player and Synchronization -- Play a movie or synch a movie to experimental data
- Presentation Style Graph -- Additional Graph style that moves measurements and units outside the Graph; ideal for publication of DataStudio graphs in educational journals
- Predictive Sketching -- Students can draw directly on the...
Category: Home & Education / Miscellaneous
Publisher: PASCO, License: Demo, Price: USD $0.00, File Size: 32.8 MB
Platform: Windows
This applet is designed to take multiple series of numerical data and display the information as a 3D Multi series Line Graph. The applet will automatically size itself to the available area given to it by the HTML form. (The WIDTH and HEIGHT of the APPLET tag.)
The applet is easy to use and highly configurable and contains the following features,
General Features...
Category: Business & Finance / Applications
Publisher: Sirius Computer Consultants Limited, License: Demo, Price: USD $30.00, File Size: 60.0 KB
Platform: Windows, Linux

Archim is a program for drawing the graphs of all kinds of functions. You can define a Graph explicitly and parametrically, in polar and spherical coordinates, on a plane and in space (surface). Archim will be useful for teachers and students, as well as for everyone who is interested min geometry. With Archim, you will draw the Graph of any function and form, just use your...
Category: Home & Education
Publisher: Stochastic Lab, License: Freeware, Price: USD $0.00, File Size: 479.6 KB
Platform: Windows
Graph-A-Ping allows you to visually see the ping latency between ping times.
Graph-A-Ping allows you to visually see the ping latency between ping times. The bigger the gap between one ping to another allows you to spot possible network bottle neck.
This tool is actually an applet part of Glass Net Networks monitoring console.
Category: Internet / Misc. Plugins
Publisher: Mataluis.Com, License: Freeware, Price: USD $0.00, File Size: 2.1 MB
Platform: Windows
This 3D Stacked Vertical Bar Graph provides both a client and server side solution for the incorporation of bar graphs into Web pages. It provides versatile components so that Web authors and Java developers can easily build and publish dynamic and interactive bar graphs. We have built in many configurable features and functions to both the applet and servlet and as such,...
Category: Multimedia & Design / Multimedia App's
Publisher: Sirius Computer Consultants Limited, License: Shareware, Price: USD $99.95, File Size: 276.0 KB
Platform: Windows
The Library GraphDiag is intended for building Graph and diagrams on HBITMAP, surface DirectDraw and in file BMP format. The Library can build the graphs on entered text Line and diagrams, as from tables, which format is provided by developer, so and from files HTML-format and from XLS files Excel. Given version first and is not deprived defect and restrictions. The Restrictions...
Category: Software Development / Components & Libraries
Publisher: Kruchinin Aleksandr, License: Freeware, Price: USD $0.00, File Size: 67.0 KB
Platform: Windows
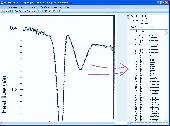
Graph FAWM is a function graphing tool that is easy for teachers and students to use.
Graph FAWM is a function graphing tool that is easy for teachers and students to use. A wealth of information is available about any Graph just by moving the mouse pointer to a point of interest.
Category: Business & Finance / Applications
Main Features:
- True algebraic equation format
- Implicit equations
- Locates intercepts, turning points and points of intersection
Publisher: New FAWM Creations, License: Shareware, Price: USD $20.00, File Size: 4.6 MB
Platform: Windows
XYZ Data Viewer is a Excel table to 3-D graph converter.
XYZ Data Viewer is a Excel table to 3-D Graph converter. It provide easy way to analyze a variety of tabular data from Microsoft Excel in the view of 3-dimensions Graph. With this tool You can view and examine your data as a three-dimensional object in three-dimensional space, by manipulate the 3d object on the program screen. You can save this 3d Graph as a file and upload...
Category: Multimedia & Design / Media Management
Publisher: 3 Fish Software, License: Shareware, Price: USD $69.95, File Size: 9.1 MB
Platform: Windows
dcsDigitiser, a Graph digitizer and densitometer, converts graphs into digital X-Y numerical numbers for peer analysis of graphs and gel in the open literature and/or of your own hard copies. With excellent performance, dcsDigitiser is accurate, precise, versatile and straightforward in its use. It is now only a few clicks to get a numerical reading of graphs of interest while surfing on...
Category: Home & Education / Mathematics
Publisher: J & C Consultation and Technology, License: Shareware, Price: USD $120.00, File Size: 3.8 MB
Platform: Windows
BitMeter 2 is a bandwidth meter, it allows you to visually monitor your internet connection by displaying a scrolling Graph that shows your upload and download speed over time. BitMeter is freeware - ie. it is given away completely free of charge, there is no trial period, no time-limited features, no spyware, and no adware, guaranteed. BitMeter displays a coloured Graph showing...
Category: Internet / Monitoring
Publisher: Codebox Software, License: Freeware, Price: USD $0.00, File Size: 1013.8 KB
Platform: Windows
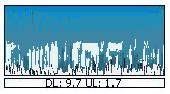
BitMeter 2 is a bandwidth meter, it allows you to visually monitor your internet connection by displaying a scrolling Graph that shows your upload and download speed over time. BitMeter is freeware - ie. it is given away completely free of charge, there is no trial period, no time-limited features, no spyware, and no adware, guaranteed. BitMeter displays a coloured...
Category: Internet
Publisher: Codebox Software, License: Freeware, Price: USD $0.00, File Size: 1017.3 KB
Platform: Windows
aiSee reads a textual, easy-to-read and easy-to-learn Graph specification and automatically calculates a customizable Graph layout. This layout is then displayed, and can be interactively explored, printed and exported to various graphic formats.
See has been optimized to handle huge graphs automatically generated by applications. It is available for Windows, Linux, and Mac...
Category: Home & Education / Miscellaneous
Publisher: Ai-See, License: Shareware, Price: USD $395.00, File Size: 18.2 MB
Platform: Windows
SD-Graph v1.0 is a sophisticated bar graphing system that allows you to create and display colorful bar charts with detailed statistics.
Category: Software Development
Publisher: Spriteworks Developments, License: Demo, Price: USD $14.95, File Size: 18.1 KB
Platform: Unknown
Graph Extract is a program for digitizing plots.
Graph Extract is a program for digitizing plots. Using either manual or automated approaches, this program provides a means to easily extract numeric data from plots. The resulting X-Y data can be printed or replotted, or it can be saved in Excel file for
Category: Multimedia & Design
Publisher: quadtechassociates.com, License: Freeware, Price: USD $0.00, File Size: 446.0 KB
Platform: Windows
 Shareware
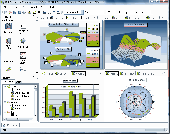
DataScene is a data graphing, animation, and analysis software package. It allows the user to easily plot 2D & 3D graphs (Area, Bar, Pie, Line, Surface, Ploar, and more) with scientific, financial, and statistical data, to manipulate, print, and export high quality graphs, to analyze data with various mathematical methods (fitting curves, calculating statics, FFT, and more), to create...
Category: Multimedia & Design / Authoring Tools
Publisher: CyberWit, Inc., License: Shareware, Price: USD $219.00, File Size: 44.1 MB
Platform: Windows
CoGui is a free Graph-based visual tool, developed in Java, for building Conceptual Graph knowledge bases represented in COGXML format, compatible with Cogitant.
Category: Multimedia & Design / Video
Features:
- Intuitive visual structures for building real-world knowledge bases
- Reasoning capabilities with Cogitant
- XML persistent storage
Functionalities:
Publisher: LIRMM, License: Shareware, Price: USD $0.00, File Size: 0
Platform: Windows
Shareware
Properly monitoring and maintain aquarium conditions can lead to a truly beautiful and healthy aquarium. Aquarium Lab makes it easy to track and Graph water quality conditions for 21 different parameters. Keep a photo profile of fish and corals. Includes many different unit converters and calculators for aquarium volume and weight and power consumption. The program supports multiple...
Category: Home & Education / Hobbies
Publisher: SeaApple Software, License: Shareware, Price: USD $24.95, File Size: 94.2 MB
Platform: Windows