Free Downloads: Data Graphs
License: All | Free
RLPlot is is a plotting program to create high quality graphs from data.
RLPlot is is a plotting program to create high quality Graphs from Data. Based on values stored in a spreadsheet several menus help you to create Graphs of your choice. The Graphs are displayed as you get them (Wysiwyg). Double click any element of the gr
Category: Multimedia & Design
Publisher: rlplot.sourceforge.net, License: Freeware, Price: USD $0.00, File Size: 1024.0 KB
Platform: Windows, Mac, 2K, 2K3
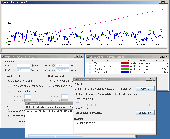
This is an data logging software.
This is an Data logging software. It is used for system configuration (naming sensors, setting alarm thresholds), downloading of Data to a computer (for long term storage), graphical analysis of Data (using inbuilt features or exporting Data to other software applications), publishing Data to a website (Graphs and raw Data), and computer...
Category: Internet / Misc. Plugins
Publisher: Pico Technology, License: Freeware, Price: USD $0.00, File Size: 10.0 MB
Platform: Windows
The HBU is an Hymedis client application that allows you to present the Hymedis information on Graphs and as normal Data. Different Hymedis parameters can be presented as Graphs or as updated Data.
In different tabs a user can select parameter combinations and, when a connection is established, every minute the latest Data is picked up from the central...
Category: Multimedia & Design / Multimedia App's
Publisher: HBU, License: Freeware, Price: USD $0.00, File Size: 51.6 MB
Platform: Windows
If you are searching for a computer program that can plot simple Graphs on your PC, GraphSight Junior is what you are looking for. This utility is feature rich and comprehensive. It plots 2D Graphs with easy navigation, and it’s well suited for high school and college math students.
It can plot Cartesian, polar, table defined, as well as specialty Graphs, such...
Category: Home & Education / Mathematics
Publisher: CradleFields.com, License: Freeware, Price: USD $0.00, File Size: 417.5 KB
Platform: Windows
RJS Graph produces professional scientific and mathematical graphs.
RJS Graph produces professional scientific and mathematical Graphs. You may study the Data with a wide range of Data analysis tools. Features include the ability to plot Data and equations, fit best fit curves and splines, and display fitted best fit curve parameters. Data can be pasted from a spreadsheet or imported from a text file using a wizard.
Category: Home & Education / Mathematics
Publisher: RJS, License: Freeware, Price: USD $0.00, File Size: 3.7 MB
Platform: Windows
Graph constructs, visualizes and modifies graphs as well as calculates measures and layouts.
Graph constructs, visualizes and modifies Graphs as well as calculates measures and layouts.
CoSBiLab Graph can construct, visualize and modify Graphs as well as calculate measures and layouts. CoSBiLab Graph can import and export Data in a variety of formats, among which the reaction network generated by the beta WorkBench.
Category: Multimedia & Design / Multimedia App's
Publisher: CoSBi, License: Freeware, Price: USD $0.00, File Size: 3.1 MB
Platform: Windows
Murata Chip S-Parameter & Impedance Library enables you to calculate, view and print Graphs of the impedance and S parameter Data for chip capacitors or chip inductors. S parameter Data in Touchstone format can also be copied.
Main features:
- Easy operation due to using Windows interface.
- Fast calculation of Data and...
Category: Business & Finance / Applications
Publisher: Murata Manufacturing. Co., Ltd., License: Freeware, Price: USD $0.00, File Size: 3.3 MB
Platform: Windows
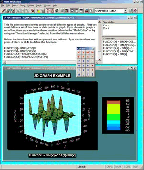
DaqLab is a comprehensive program that provides you everything you need in order to collect Data from the DaqPRO, display the Data in Graphs, meters and tables and analyze it with sophisticated analysis tools.
The program includes three windows: A graph window, table window, and a navigation window called the Data Map. You can display all three windows...
Category: Multimedia & Design / Multimedia App's
Publisher: Fourier Systems, License: Freeware, Price: USD $0.00, File Size: 10.4 MB
Platform: Windows
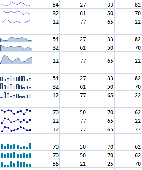
TinyGraphs is an open source Excel add-in that creates sparklines, mini column Graphs, and area Graphs from a row of Data. It generates beautiful tiny graphics that are as small as a cell and can be placed next to the items that they describe. The tiny graphics, or sparklines, are as tall as the text around them and are useful for visualizing large quantities of...
Category: Business & Finance / Spreadsheets
Publisher: ConnectCode Pte Ltd, License: Freeware, Price: USD $0.00, File Size: 344.0 KB
Platform: Windows
Wykresy is a simple, user-friendly program drawing functions, Graphs as well as circles and ellipses. More than 20 function templates provide fast creation of functions. Derivatives and combinations of functions can be easily added. Up to 10 Graphs can be seen simultaniously, each of them in color set by user. It is very easy to make an approach and see more details, or browse...
Category: Home & Education / Mathematics
Publisher: Piotr Kubowicz, License: Freeware, Price: USD $0.00, File Size: 675.8 KB
Platform: Windows
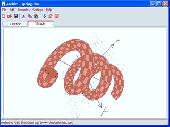
Eigenmath is a small application that can make graphs to mathematical functions.
Eigenmath is a small application that can make Graphs to mathematical functions. It is simple to use, and has a user manual that explains all the functions, so even the novice user will be able to make Graphs very quickly. It can calculate derivatives, gradients, template functions, integrals as well as make Graphs to arc length, line integrals, surface area, surface...
Category: Home & Education / Mathematics
Publisher: George Weigt, License: Freeware, Price: USD $0.00, File Size: 569.0 KB
Platform: Windows
WinADV provides the capability to quickly view time series Graphs, histograms, or FFT's of the various velocity Data. Data may be filtered on-the-fly and sampling windows may be established so that only relevant Data are plotted. For Data collected from moving, or traversing probes, an equation describing the position of the probe as a function of time...
Category: Home & Education / Science
Publisher: Bureau of Reclamation, License: Freeware, Price: USD $0.00, File Size: 3.2 MB
Platform: Windows
Software for Determining Balanced Graphs is a free software.
Software for Determining Balanced Graphs is a free software.
A computational method for determining wheether a given graph with weights on the vertices, is balanced so that it can be associated as an invariant, folds maps of closed surface in the plane, the sphere and the projective plane.
Category: Business & Finance / Applications
Publisher: Jeferson Coelho, P. David Romero and C. Mendes Jesus, License: Freeware, Price: USD $0.00, File Size: 1012 B
Platform: Windows
Free Daily Thoroughbred Handicapping Graphs available for all tracks running.
Free Daily Thoroughbred Handicapping Graphs available for all tracks running.. Designed using a 2 million-line database. A7 is simplest, fastest software ever created. A single click prints the Graphs an entire card. No charge. Nothing to buy. FREE expert analysis available everyday. Even children can pick winners using this FREE software. From the 15 year leader in thoroughbred...
Category: Utilities / System Utilities
Publisher: RaceCom, Inc, License: Freeware, Price: USD $0.00, File Size: 1.9 MB
Platform: Windows
This sample uses simple animation and UI-control chart Components to help you visualize annual sales erformance Data.
The TableInsights application displays a table of sales performance Data for each month over one-year period for various regions. It uses the UI control ScrollView at the bottom to navigate left and right to view the Data table.
...
Category: Web Authoring / JavaScript
Publisher: Oracle Corporation, License: Freeware, Price: USD $0.00, File Size: 0
Platform: Windows
The DrillView module lets you create fully attributed 3d polyline themes from your drilling Data, and then display these with options of histograms, line Graphs or coloured text for the down hole Data. DrillView is an excellent tool for visualising your drilling Data in a GIS environment.
Category: Multimedia & Design / Multimedia App's
Publisher: TerraSolutions SoftZone Pty Ltd, License: Freeware, Price: USD $0.00, File Size: 9.9 MB
Platform: Windows
Display your data with built-in graphs or WYSIWYG html editor. . .
Category: Software Development
Publisher: Olav Botterli Konsulenttjenester, License: Freeware, Price: USD $0.00, File Size: 6.3 MB
Platform: Windows, Linux
Fronius Solar.access is intelligent software for recording, archiving and analyzing system Data on the PC. It is used for the comprehensive analysis and display of system performance Data using clear diagrams and Graphs. You can configure the software parameters of all inverter system components as well as Fronius DATCOM components using Fronius Solar.access. Fronius...
Category: Utilities / System Utilities
Publisher: FRONIUS International GmbH, License: Freeware, Price: USD $0.00, File Size: 29.3 MB
Platform: Windows
This application renders a number of moving fragments of sine and cosine Graphs, meant to be visually attractive. For Windows XP. The application is designed for use on a modern LCD.
Category: Home & Education / Miscellaneous
Publisher: english.rejbrand.se, License: Freeware, Price: USD $0.00, File Size: 517.0 KB
Platform: Windows
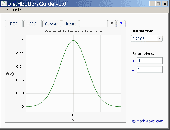
Distribution Guide is a program allowing to build various graphs of statistical distributions.
Distribution Guide is a program allowing to build various Graphs of statistical distributions. It enables you to enter the parameters of the particular distribution and display the Graphs of such functions as PDF, CDF, and others. Printing support is provided as well.
Supported distributions:
- Exponential
- Lognormal
- Normal
- Weibull
-...
Category: Home & Education / Mathematics
Publisher: MathWave Technologies, License: Freeware, Price: USD $0.00, File Size: 1.1 MB
Platform: Windows
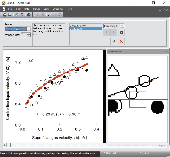
Obtain Data from images of Graphs scanned from articles or available as image. Import the graph into ScanIt from a scanner or file, or from the clipboard. Define locations of the graph's axes by indicating known points. Extract Data from the graph by manually picking points, by scanning for points or by scanning along curves. Copy the scanned Data to Excel or export...
Category: Home & Education / Science
Publisher: amsterchem, License: Freeware, Price: USD $0.00, File Size: 6.1 MB
Platform: Windows
MatheGrafix is an excellent tool that allows you to plot 2D Graphs including linear, geometric, exponential, fractals ones and more. The program operates in two modes: you can introduce the formula and plot the graph or you can draw interactively a geometric function on the graph.
There are two important windows: the "Mode functions" window which is the main one,...
Category: Business & Finance / Applications
Publisher: Roland Hammes, License: Freeware, Price: USD $0.00, File Size: 1.8 MB
Platform: Windows


 Freeware
Origramy is a new and sole flash component. It is specially designed for online editing and displaying diagrams, Graphs, workflows, organograms, fluxograms, timelines, tree structures, business processes and even builds simple presentations. In two modes webmasters and developers can create various kinds of Graphs and diagrams. In edit mode they can build the scene, place...
Category: Web Authoring / Flash Utilities
Publisher: Origramy, License: Freeware, Price: USD $0.00, File Size: 569.9 KB
Platform: Windows, Mac, Linux
The EZ Health Oracle Diabetes Management System is a personal computer (PC) software application that allows users to upload test Data from meters, store the Data in the Diabetes Management System application and analyzes the Data by Graphs and other software tools.
Category: Utilities / Misc. Utilities
Publisher: EZ Health Oracle, License: Freeware, Price: USD $0.00, File Size: 21.1 MB
Platform: Windows
ZGrapher is a simple graphic utility.
ZGrapher is a simple graphic utility. It can be helpful for any user, from a schoolboy to a professional mathematician. Using this program you can plot Graphs of the following types: Y(x), X(y), R(a) – in polar coordinates, X(t) and Y(t) – parametric equations and Graphs of tables. To create a graph you should specify its parameters – formula, graph’s...
Category: Home & Education / Mathematics
Publisher: Palam Software, Inc., License: Freeware, Price: USD $0.00, File Size: 619.8 KB
Platform: Windows
The Ultimate Speed Test: - Speed Test (Actual Maximum speed) - Monitor Upload/Download transfer - Ping Testing - Website Downtime/Error monitoring - Website response time, connection time and bandwidth - QOS - WIFI Signal strength - LAN/WAN/Home network bandwidth testing - CPU Usage - Memory usage - Hard Drive space monitoring - Hard Drive Activity - Battery charge...
Category: Internet
Publisher: Absolute Futurity, License: Freeware, Price: USD $0.00, File Size: 3.9 MB
Platform: Windows
This series lets users experiment with, build, study the math of, and play a game based on 3D scene Graphs--the hierarchy of transformations used to draw objects in a 3D scene.
This first applet shows how changing the transformations of a scene graph affects the final result and how each transformation affects the space in which child nodes are transformed.
...
Category: Games / Misc. Games
Publisher: Brown University, License: Freeware, Price: USD $0.00, File Size: 1.3 KB
Platform: Windows
Graph visualization is a way of representing structural information as diagrams of abstract Graphs and networks. Automatic graph drawing has many important applications in software engineering, database and web design, networking, and in visual interfaces
Category: Multimedia & Design
Publisher: graphviz.org, License: Freeware, Price: USD $0.00, File Size: 26.6 MB
Platform: Windows, Mac, Vista
Drawing graphs without the right tool is simply difficult.
Drawing Graphs without the right tool is simply difficult. uDraw(Graph) automates this task for you. Find out how uDraw(Graph) creates your flow charts, diagrams, hierarchies or structure visualizations using automatic layout - much faster than with any standard drawing program. With the API, uDraw(Graph) can even be embedded in your own programs as a visualization component.
Category: Multimedia & Design / Image Editing
Publisher: University Bremen, FB3, Germany, License: Freeware, Price: USD $0.00, File Size: 2.6 MB
Platform: Windows
Symphonie Data Retriever is a tool to perform the raw file conversion process and the Data base import process under the control of your automation. You can import Data, scale Data, export Data and generate reports (windrose, frequency distribution, monthly Graphs, etc.) for Symphonie, 9300, 9200-Plus, and Wind Explorer.
You can create,...
Category: Utilities / File & Disk Management
Publisher: NRG Systems, License: Freeware, Price: USD $0.00, File Size: 5.8 MB
Platform: Unknown
ViewADP is a Windows-based data display and analysis program.
ViewADP is a Windows-based Data display and analysis program. It is a post-processing package
designed specifically for use with the Data collected by any SonTek Acoustic Doppler Profiler
(ADP™). ViewADP allows you to quickly and easily look at ADP Data in a variety of ways:
Contour plots, time-series Graphs, 2D/3D profiles, ASCII text files.
Category: Multimedia & Design / Image Editing
Publisher: SonTek/YSI, License: Freeware, Price: USD $0.00, File Size: 2.0 MB
Platform: Windows
Combine the Abbot Diabetes Care CoPilot™ Health Management System and the OmniPod Extension software to create customized charts and Graphs of the Data from your PDM.
By teaming the CoPilot Health Management System with the OmniPod Extension software you can:
Download insulin, BG and carbohydrate records from your PDM to your computer.
Upload...
Category: Home & Education / Health & Nutrition
Publisher: Insulet Corp., License: Freeware, Price: USD $0.00, File Size: 343.6 KB
Platform: Windows


 Freeware
Origramy is a XML-driven flash graph component specially made for building, editing and displaying Graphs and diagrams of various kinds. In two modes of the component webmasters and developers can fast and easily create, modify and present any Graphs, presentations, flowcharts, organization structures, algorithms layouts, fluxograms, specific diagrams, objects references map, etc....
Category: Web Authoring / Flash Utilities
Publisher: Origramy, License: Freeware, Price: USD $0.00, File Size: 781.4 KB
Platform: Windows, Mac, Linux
Colorblind Assistant is free software that instantly picks the color from the mouse pointer, providing you with a written name of the color, as well as other useful Data such as RGB values and bar Graphs, brightness and saturation. The software also has a
Category: Desktop Enhancements
Publisher: achronism.com, License: Freeware, Price: USD $0.00, File Size: 901.0 KB
Platform: Windows, Mac, Vista
LiveGraph is a framework for real-time Data visualisation, analysis and logging. Distinctive features: - A real-time plotter that can automatically update Graphs of your Data while it is still being computed by your application. - Concise and simple point-and-click interface that allows to quickly select and compare Data series even in applications that...
Category: Home & Education / Science
Publisher: LiveGraph open-source project, License: Freeware, Price: USD $0.00, File Size: 889.0 KB
Platform: Windows, Mac, Linux
Active CPU 1.0 is a small yet useful utility that resembles the built-in task manager tool that comes with Microsoft NT platforms such as Windows NT series, XP and Vista.
The program has a simple window which displays a nice graph that represents the current and past CPU usage history and a percentage meter that tells how much CPU is consumed. The update speed for the Graphs is...
Category: Utilities / System Utilities
Publisher: SmartLine, Inc., License: Freeware, Price: USD $0.00, File Size: 445.0 KB
Platform: Windows
ABB prosoft is a selection tool for finding the optimal ABB softstarter for your application.
ABB prosoft is a selection tool for finding the optimal ABB softstarter for your application. With this tool it is easy to specify the behavior of your process and to make ABB prosoft selecting a reliable and cost efficient ABB softstarter to meet your needs.
Input of Data
In ABB prosoft you can select motor Data or even pick an ABB motor from a list including...
Category: Business & Finance / Business Finance
Publisher: ABB Asea Brown Boveri Ltd, License: Freeware, Price: USD $0.00, File Size: 9.1 MB
Platform: Windows
Microsoft Mathematics Add-in for Word and OneNote makes it easy to plot Graphs in 2D and 3D, calculate numerical results, solve equations or inequalities, and simplify algebraic expressions in your Word documents and OneNote notebooks.
The Microsoft Mathematics Add-in can help you with the following tasks:
Compute standard mathematical functions, such as roots and...
Category: Home & Education / Mathematics
Publisher: Microsoft, License: Freeware, Price: USD $0.00, File Size: 6.6 MB
Platform: Windows
Archim is a program for drawing the Graphs of all kinds of functions. You can define a graph explicitly and parametrically, in polar and spherical coordinates, on a plane and in space (surface). Archim will be useful for teachers and students, as well as for everyone who is interested min geometry. With Archim, you will draw the graph of any function and form, just use your imagination....
Category: Home & Education
Publisher: Stochastic Lab, License: Freeware, Price: USD $0.00, File Size: 479.6 KB
Platform: Windows
This program offers you the possibility to exchange thedrawings, Graphs, and technical illustrations with coworkers, customers, partners, suppliers, and technicians.
The application can help you to saves time and reduces document printing and delivery costs.
Category: Multimedia & Design / Image Editing
Publisher: Larson Software Technology, License: Freeware, Price: USD $0.00, File Size: 9.0 MB
Platform: Windows
Math Mechanixs is an easy to use scientific and engineering FREE math software program. (FREE registration is required after 60 days). The typical tool for solving mathematical problem has been the calculator. Unfortunately, a calculator can be very limiting. They do not allow the user to record detailed notes regarding their work. Until the graphing calculator, the user could not graph...
Category: Business & Finance
Publisher: Math Mechanixs, LLC., License: Freeware, Price: USD $0.00, File Size: 8.7 MB
Platform: Windows
DPlot Viewer is a free scaled-down version of DPlot intended for use by developers who want to distribute DPlot Graphs to others. DPlot Viewer will display and print any graph produced by DPlot or DPlot Jr. As with DPlot Jr, DPlot Viewer may be redistributed to end users without royalty payments or other restrictions.
Category: Home & Education / Miscellaneous
Publisher: HydeSoft Computing, LLC, License: Freeware, Price: USD $0.00, File Size: 8.9 MB
Platform: Windows
AVE Visual Editor is a program designed to help you understand the new concept of using Graphs to create working Avisynth scripts.
With AVE you simply connect icons with lines and when graph is complete watch the output.
The generated script file is ready to render with common video editing programmes (VirtualDub, Premiere, After Effects) and mpeg2 encoder.
Category: Multimedia & Design / Digital Media Editors
Publisher: vion11, License: Freeware, Price: USD $0.00, File Size: 3.7 MB
Platform: Windows
UsbSensorViewer is a software that applies to different resolutions, display temperature, differential pressure and flow. Absolute or relative timing may be chosen and Data are displayed in Graphs. The software also contains Data-logging capabilities and Data may be exported to Excel format.
Category: Utilities / Misc. Utilities
Publisher: Sensirion AG, License: Freeware, Price: USD $0.00, File Size: 581.5 KB
Platform: Windows
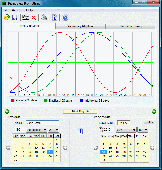
Versatile Biorhythm plotting software with user friendly interface and print option for generated Graphs and report. Full month graphical display of Primary (Physical, Emotional and Intellectual) and Secondary (Intuitional (or Intuitive), Aesthetic, (Self)Awareness and Spiritual) cycles. Printable report with in depth analysis of Primary cycles for any selected day.
Category: Home & Education / Astrology & Numerology
Publisher: Emdem Technologies, License: Freeware, Price: USD $0.00, File Size: 482.0 KB
Platform: Windows
Accepts gif, jpg, and several other picture formats. Alsocontains a measurement function to measure from point to point on a scaled picture (micrograph, map, schematic). Output is displayed realtime next to the picture and can be formatted as numeric, scientific, dates, times, or general.
Category: Home & Education / Mathematics
Publisher: datatrendsoftware, License: Freeware, Price: USD $0.00, File Size: 157.0 KB
Platform: Unknown
Gephi is an interactive visualization and exploration platform for all kinds of networks and complex systems, dynamic and hierarchical Graphs.
Runs on Windows, Linux and Mac OS X. Gephi is open-source and free.
The program is the best way for students around the world to start contributing to an open-source project.
Category: Multimedia & Design / Image Editing
Publisher: Gephi, License: Freeware, Price: USD $0.00, File Size: 25.4 MB
Platform: Windows
WebGrid have 12 column types, 40 events, and have more then 100 properties for you to play with.
WebGrid have 12 column types, 40 events, and have more then 100 properties for you to play with. This enables you to create faster and better web applications with an unequaled level of customization. Advantages of using WebGrid ------------------------------------ Detects and cache Data source structures and enables "plug and play" for you. WebGrid generates a html-form, and...
Category: Web Authoring / Scripts & CGI Tools
Publisher: WebGrid Software, License: Freeware, Price: USD $0.00, File Size: 23.4 MB
Platform: Windows, Linux
An utility to track network usage, showing actual vertical bar Graphs for both download and upload byte amounts. It lets you determine if a download failed or if it has finished (no download activity). It is also useful for detecting at a glance if someone's stealing files and documents from your computer (unexpected upload activity).
Category: Internet / Monitoring
Publisher: Daniele Giabbai, License: Freeware, Price: USD $0.00, File Size: 1.7 MB
Platform: Windows
LiveMath Viewer can open all LiveMath notebooks, and allows you to interact, explore, and change LiveMath expressions and Graphs. LiveMath Viewer looks exactly the same as LiveMath Maker, but has the reduced functionality of LiveMath Plug-In.
LiveMath Viewer includes the Examples and Help areas of LiveMath Maker, so that you may try out the LiveMath system in a live demonstration.
Category: Business & Finance / Applications
Publisher: MathMonkeys, LLC, License: Freeware, Price: USD $0.00, File Size: 1.2 MB
Platform: Windows

