Free Downloads: Excel Graphs And Charts
License: All | Free
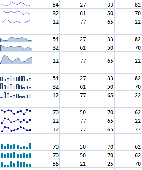
TinyGraphs is an open source Excel add-in that creates sparklines, mini column Graphs, and area Graphs from a row of data. It generates beautiful tiny graphics that are as small as a cell and can be placed next to the items that they describe. The tiny graphics, or sparklines, are as tall as the text around them and are useful for visualizing large quantities of data, such...
Category: Business & Finance / Spreadsheets
Publisher: ConnectCode Pte Ltd, License: Freeware, Price: USD $0.00, File Size: 344.0 KB
Platform: Windows
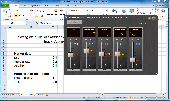
Excel Mixer Nano is the quickest, most efficient, safest and cheepest way to bring your Excel data and Excel Charts to life with your mouse!
All you have to do is select a range of cells in Excel, and Excel Mixer Nano will provide you with a slider (or scroll bar) for each cell, with adjustable min, max and step!
Excel Mixer Nano...
Category: Business & Finance / MS Office Addons
Publisher: ConvexDNA, License: Freeware, Price: USD $0.00, File Size: 6.0 MB
Platform: Windows
 Freeware
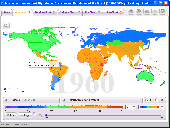
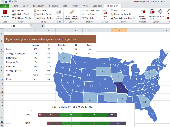
Free standalone software DataPult Desktop creates heat maps from your data quickly and efficiently. Key features: Direct data import from MS Excel with one click. The ability to create animated maps of data over several years. Interactive maps and diagrams. 39 map colorings for making heat maps. Intelligent identification of input regions and automatic...
Category: Business & Finance / MS Office Addons
Publisher: DataPult, License: Freeware, Price: USD $0.00, File Size: 21.0 MB
Platform: Windows
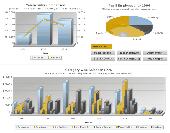
FusionCharts Free is a flash charting component that can be used to render data-driven & animated Charts for your web applications and presentations. It is a cross-browser and cross-platform solution that can be used with ASP.NET, ASP, PHP, JSP, ColdFusion, Ruby on Rails, simple HTML pages or even PowerPoint Presentations to deliver interactive and powerful flash Charts. You...
Category: Software Development
Publisher: InfoSoft Global (P) Ltd., License: Freeware, Price: USD $0.00, File Size: 2.7 MB
Platform: Windows, Mac, Linux,
Accepts gif, jpg, and several other picture formats. Alsocontains a measurement function to measure from point to point on a scaled picture (micrograph, map, schematic). Output is displayed realtime next to the picture and can be formatted as numeric, scientific, dates, times, or general.
Category: Home & Education / Mathematics
Publisher: datatrendsoftware, License: Freeware, Price: USD $0.00, File Size: 157.0 KB
Platform: Unknown
Freeware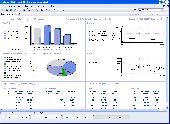
MyOra is a free SQL Tool for Oracle database developers and DBAs. This tool is simple, fast and easy to use, requires no installation, no Oracle client and no internet connection. Just download, unzip and start using with a click of the mouse, run SQL queries and Monitor database performance in Real Time. MyOra’s MDI (Multi Document Interface) framework handles multiple sub-windows opened at...
Category: Software Development / Databases & Networks
Publisher: Jayam Systems, LLC, License: Freeware, Price: USD $0.00, File Size: 1.0 MB
Platform: Windows
Drawing graphs without the right tool is simply difficult.
Drawing Graphs without the right tool is simply difficult. uDraw(Graph) automates this task for you. Find out how uDraw(Graph) creates your flow Charts, diagrams, hierarchies or structure visualizations using automatic layout - much faster than with any standard drawing program. With the API, uDraw(Graph) can even be embedded in your own programs as a visualization component.
Category: Multimedia & Design / Image Editing
Publisher: University Bremen, FB3, Germany, License: Freeware, Price: USD $0.00, File Size: 2.6 MB
Platform: Windows
OfficeReports makes it easy to create Charts, tables and other infographics in your workbooks, presentations and documents in the layout you like! No matter if you have your data in Excel or SPSS format, or would like to connect directly to your SurveyMonkey survey. This saves lots of time and reduces the risk of errors! You can create your own layout definitions, and create...
Category: Business & Finance / MS Office Addons
Publisher: OfficeReports, License: Freeware, Price: USD $0.00, File Size: 406.0 KB
Platform: Windows
Combine the Abbot Diabetes Care CoPilot™ Health Management System and the OmniPod Extension software to create customized Charts and Graphs of the data from your PDM.
By teaming the CoPilot Health Management System with the OmniPod Extension software you can:
Download insulin, BG and carbohydrate records from your PDM to your computer.
Upload...
Category: Home & Education / Health & Nutrition
Publisher: Insulet Corp., License: Freeware, Price: USD $0.00, File Size: 343.6 KB
Platform: Windows
RLPlot is is a plotting program to create high quality graphs from data.
RLPlot is is a plotting program to create high quality Graphs from data. Based on values stored in a spreadsheet several menus help you to create Graphs of your choice. The Graphs are displayed as you get them (Wysiwyg). Double click any element of the gr
Category: Multimedia & Design
Publisher: rlplot.sourceforge.net, License: Freeware, Price: USD $0.00, File Size: 1024.0 KB
Platform: Windows, Mac, 2K, 2K3
WebGrid free library package contains utilities used by WebGrid - plug and play grid and are found in the namespace "WebGrid.Util". In this package are WebGrid - free Charts. A easy-to-use charting solution for unique and data presentation. Please see our homepage for a live demo of WebGrid - free Charts.
Category: Software Development
Publisher: WebGrid Software, License: Freeware, Price: USD $0.00, File Size: 1.2 MB
Platform: Windows, Linux
JFreeChart is a free Java class library for generating Charts (GNU LGPL). Support is included for: pie Charts, bar Charts, line Charts, scatter plots, time series Charts, candlestick Charts, high-low-open-close Charts and more. Use in applications, servlets, JSP or applets. Export to PNG, JPEG, PDF, SVG and HTML image maps. Complete source...
Category: Software Development
Publisher: Object Refinery Limited, License: Freeware, Price: USD $0.00, File Size: 5.3 MB
Platform: Windows, Linux, Unix
Download the DEMO at www.EasyProjectViewer.com LICENSE INCLUDES UNLIMITED DISTRIBUTION TO PROJECT TEAM MEMBERS AND UNLIMITED VERSION UPGRADES EasyGantt simulates an enterprise task management system using an easy-to-use Excel file that requires no installation program or add-ins. EasyProjectPlan is designed for distribution to project team members so they can easily input their tasks,...
Category: Business & Finance / Project Management
Publisher: EasyProjectViewer.com, License: Freeware, Price: USD $0.00, File Size: 1024 B
Platform: Windows
Displays Dukascopy charts for several currency pairs.
Displays Dukascopy Charts for several currency pairs. Resizeable, six chart periods, four chart types and a choice of optional indicators. Flat periods may be removed from the Charts by selecting a check box.
Category: Business & Finance / Business Finance
Publisher: Chris Craig, License: Freeware, Price: USD $0.00, File Size: 173.0 KB
Platform: Unknown
Display your data with built-in graphs or WYSIWYG html editor. . .
Category: Software Development
Publisher: Olav Botterli Konsulenttjenester, License: Freeware, Price: USD $0.00, File Size: 6.3 MB
Platform: Windows, Linux

Used by HR professionals world-wide.
Used by HR professionals world-wide. OrgChart Professional can help you automate your organization Charts so you can keep pace with re-organizations and frequent personnel changes. With our organization chart software, you can create org Charts in minutes, track key employee information such as appraisals, contact information, job descriptions, etc. Our org chart software powerful...
Category: Business & Finance / Applications
Publisher: Officework Software, License: Freeware, Price: USD $0.00, File Size: 40.2 MB
Platform: Windows
Wykresy is a simple, user-friendly program drawing functions, Graphs as well as circles and ellipses. More than 20 function templates provide fast creation of functions. Derivatives and combinations of functions can be easily added. Up to 10 Graphs can be seen simultaniously, each of them in color set by user. It is very easy to make an approach and see more details, or browse...
Category: Home & Education / Mathematics
Publisher: Piotr Kubowicz, License: Freeware, Price: USD $0.00, File Size: 675.8 KB
Platform: Windows
Eigenmath is a small application that can make graphs to mathematical functions.
Eigenmath is a small application that can make Graphs to mathematical functions. It is simple to use, and has a user manual that explains all the functions, so even the novice user will be able to make Graphs very quickly. It can calculate derivatives, gradients, template functions, integrals as well as make Graphs to arc length, line integrals, surface area, surface...
Category: Home & Education / Mathematics
Publisher: George Weigt, License: Freeware, Price: USD $0.00, File Size: 569.0 KB
Platform: Windows
Software for Determining Balanced Graphs is a free software.
Software for Determining Balanced Graphs is a free software.
A computational method for determining wheether a given graph with weights on the vertices, is balanced so that it can be associated as an invariant, folds maps of closed surface in the plane, the sphere and the projective plane.
Category: Business & Finance / Applications
Publisher: Jeferson Coelho, P. David Romero and C. Mendes Jesus, License: Freeware, Price: USD $0.00, File Size: 1012 B
Platform: Windows
Budget Master is a free personal budgeting program.
Budget Master is a free personal budgeting program. You can use it to budget your personal finances and track your spendings. The program has Graphs and reports to give you a visual representation of your budget. The program simply allows you to enter your paycheck information for each month. You can create categories and budget spendings for each of those categories. The program allows...
Category: Business & Finance / Personal Finance
Publisher: Brad Wall, License: Freeware, Price: USD $0.00, File Size: 4.6 MB
Platform: Windows
Fronius Solar.access is intelligent software for recording, archiving and analyzing system data on the PC. It is used for the comprehensive analysis and display of system performance data using clear diagrams and Graphs. You can configure the software parameters of all inverter system components as well as Fronius DATCOM components using Fronius Solar.access. Fronius Solar.access is...
Category: Utilities / System Utilities
Publisher: FRONIUS International GmbH, License: Freeware, Price: USD $0.00, File Size: 29.3 MB
Platform: Windows
Free Daily Thoroughbred Handicapping Graphs available for all tracks running.
Free Daily Thoroughbred Handicapping Graphs available for all tracks running.. Designed using a 2 million-line database. A7 is simplest, fastest software ever created. A single click prints the Graphs an entire card. No charge. Nothing to buy. FREE expert analysis available everyday. Even children can pick winners using this FREE software. From the 15 year leader in thoroughbred...
Category: Utilities / System Utilities
Publisher: RaceCom, Inc, License: Freeware, Price: USD $0.00, File Size: 1.9 MB
Platform: Windows
A function of DDE is to allow Windows applications to share data.
A function of DDE is to allow Windows applications to share data. A cell in Microsoft® Excel can be linked to a value or data point in the OEC Trader. If the value or data point changes, it is automatically updated in the Microsoft® Excel spreadsheet.
Features:
* Drag-n-drop DDE links from OEC Trader to Microsoft® Excel
* Drag-n-drop values...
Category: Business & Finance / Business Finance
Publisher: optionsXpress, Inc., License: Freeware, Price: USD $0.00, File Size: 657.4 KB
Platform: Windows
We have invested 3 years into developing our Excel Gantt Chart templates incorporating the requirements of hundreds of customers. Whilst our solutions look simple and are easy to use, they are the most powerful, professional Gantt Chart templates available.
After years in senior Project Management roles, the founder of Chart Gantt, Marcus Tarrant, found that most project plans...
Category: Business & Finance / Project Management
Publisher: Chartgantt.com, License: Freeware, Price: USD $0.00, File Size: 466.0 KB
Platform: Windows, Mac
PosiSoft® Software for Windows® is an ideal solution for those who wish to download measurements to a P.C. for printing or archiving.
Features:
-Simple installation and easy-to-use graphical user interface.
-Quick and easy transfer of readings from the gage
-Support for Windows 2000 SP3 , XP, Vista & 7
-Multi-language support including...
Category: Utilities / Misc. Utilities
Publisher: DeFelsko Corp, License: Freeware, Price: USD $0.00, File Size: 11.4 MB
Platform: Windows
Stopwatch - AddIn for Excel. A little stopwatch in form of an Excel menu bar.Check your working time and performance at work with Excel.Supports English, German, and French Languages. (Excel 2000 und XP)
Category: Desktop Enhancements
Publisher: excel-addins.de, License: Freeware, Price: USD $0.00, File Size: 47.3 KB
Platform: Windows
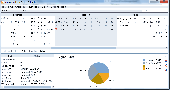
NeoNeuro Pivot Table. Free. Automatic Pivot Table shows trends and Charts, reveals leaders and outsiders in all parameters like region, product or in any others in one click! Only one mouse click is enough to get trends or pie Charts, reveal leaders and outsiders in all parameters like region, product or in any others. Use filters to get answers for complicated questions like...
Category: Business & Finance / Business Finance
Publisher: NeoNeuro LLC, License: Freeware, Price: USD $0.00, File Size: 10.3 MB
Platform: Windows
Graph constructs, visualizes and modifies graphs as well as calculates measures and layouts.
Graph constructs, visualizes and modifies Graphs as well as calculates measures and layouts.
CoSBiLab Graph can construct, visualize and modify Graphs as well as calculate measures and layouts. CoSBiLab Graph can import and export data in a variety of formats, among which the reaction network generated by the beta WorkBench.
Category: Multimedia & Design / Multimedia App's
Publisher: CoSBi, License: Freeware, Price: USD $0.00, File Size: 3.1 MB
Platform: Windows
If you are searching for a computer program that can plot simple Graphs on your PC, GraphSight Junior is what you are looking for. This utility is feature rich and comprehensive. It plots 2D Graphs with easy navigation, and it’s well suited for high school and college math students.
It can plot Cartesian, polar, table defined, as well as specialty Graphs, such...
Category: Home & Education / Mathematics
Publisher: CradleFields.com, License: Freeware, Price: USD $0.00, File Size: 417.5 KB
Platform: Windows
There is no special installation process - simply unzip all the files to a folder and open XLStatistics.xlam (Excel 2007 ) or XLStats.xls (older versions of Excel).
XLStatistics is a set of Microsoft Excel workbooks for statistical analysis of data. The workbooks are designed to implement a step-by-step guide to the statistical analysis of data (this guide appears...
Category: Utilities / System Utilities
Publisher: Rodney Carr, License: Freeware, Price: USD $0.00, File Size: 6.6 MB
Platform: Windows
Traders demand tools which are powerful, reliable, fast and easy to use.
Traders demand tools which are powerful, reliable, fast and easy to use. Netquote delivers this with the introduction of Netquote Charts, the next generation in desktop charting applications.
Netquote Charts is a fully featured technical analysis charting application. Combining sophisticated market tools in a modern easy to use interface. Best of all Netquote...
Category: Business & Finance / MS Office Addons
Publisher: Netquote Information Services Pty Ltd, License: Freeware, Price: USD $0.00, File Size: 9.1 MB
Platform: Windows
RealtimeStockreader shows you the intraday charts of your stock symbols.
RealtimeStockreader shows you the intraday Charts of your stock symbols. These Charts are being updated every minute (the updating interval can be configured).
RealtimeStockreader alerts you (acoustically) when stocks have reached limits. You can specify lower (STOP LOSS) and upper limits.
Category: Business & Finance / Business Finance
Publisher: realtimestockreader, License: Freeware, Price: USD $0.00, File Size: 69.6 KB
Platform: Windows
When you run Timing Solution Natal Charts Viewer, you see immediately that it is totally different from other programs for natal Charts . The most programs deal with PAST explanation of movement and HOPES that the FUTURE movement repeats the patterns revealed and explained for the past. Timing Solution provides totally different approach. It is totally concentrated on the forecast...
Category: Home & Education / Astrology & Numerology
Publisher: Timing Solution, License: Freeware, Price: USD $0.00, File Size: 1.2 MB
Platform: Windows
LiveGraph is a framework for real-time data visualisation, analysis and logging. Distinctive features: - A real-time plotter that can automatically update Graphs of your data while it is still being computed by your application. - Concise and simple point-and-click interface that allows to quickly select and compare data series even in applications that output over 1000...
Category: Home & Education / Science
Publisher: LiveGraph open-source project, License: Freeware, Price: USD $0.00, File Size: 889.0 KB
Platform: Windows, Mac, Linux
This application renders a number of moving fragments of sine and cosine Graphs, meant to be visually attractive. For Windows XP. The application is designed for use on a modern LCD.
Category: Home & Education / Miscellaneous
Publisher: english.rejbrand.se, License: Freeware, Price: USD $0.00, File Size: 517.0 KB
Platform: Windows

Obtain data from images of Graphs scanned from articles or available as image. Import the graph into ScanIt from a scanner or file, or from the clipboard. Define locations of the graph's axes by indicating known points. Extract data from the graph by manually picking points, by scanning for points or by scanning along curves. Copy the scanned data to Excel or export data to file....
Category: Home & Education / Science
Publisher: amsterchem, License: Freeware, Price: USD $0.00, File Size: 6.1 MB
Platform: Windows
Free Stock Charting Software with historical charts, technical analysis indicators and news.
Free Stock Charting Software with historical Charts, technical analysis indicators and news. We have taken the open source eclipse trade and cleaned up a version specific to news and Charts with technical analysis.
Category: Business & Finance / Business Finance
Publisher: pennystocknet.com, License: Freeware, Price: USD $0.00, File Size: 26.7 MB
Platform: Windows, Vista
Quantum Charts™ empowers you to easily create and back test trading strategies in minutes with breakthrough technology that analyzes the market for you. Open a chart, click on a bar, and Quantum Charts provides you with a comprehensive list of true conditions for that bar.
Select any set of conditions you want to back test and drag them into the patent pending...
Category: Business & Finance / Business Finance
Publisher: Quantum Trading Technologies, License: Freeware, Price: USD $0.00, File Size: 454.9 KB
Platform: Windows
The Exontrol's ExGantt component is the approach to create timeline Charts (also known as Gantt Charts). Gantt chart is a time-phased graphic display of activity durations. Activities are listed with other tabular information on the left side with time intervals over the bars. Activity durations are shown in the form of horizontal bars. The exGantt component lets the user...
Category: Utilities / Misc. Utilities
Publisher: Exontrol, License: Freeware, Price: USD $0.00, File Size: 18.0 MB
Platform: Windows
Add-in Express Toys .NET is a free plug-in that adds several useful features to Microsoft Excel. This sample addin is based on Add-in Express for Office and .NET and designed to show how to create Excel add-ins, how to manage add-in toolbars and controls, and how to get access to Excel objects. Add-in Express for Office and .net supports Microsoft Excel 2000,...
Category: Utilities / System Utilities
Publisher: Add-in Express Ltd, License: Freeware, Price: USD $0.00, File Size: 832.0 KB
Platform: Windows
Excel Converter 1.0 features a silent spreadsheet to html converter. It detects changes made to the Excel file and restarts the process. Auto uploads via ftp, auto rotates slides of workbooks, and auto refreshing output web page. Requires .NET 20 and MS Excel 2003 or above.
Category: Business & Finance / Calculators
Publisher: Able Web Professionals, Inc., License: Freeware, Price: USD $0.00, File Size: 982.0 KB
Platform: Windows
Firebird , Interbase ,PostGre-Sql , Sybase, SqlLite, Mysql, Oracle, Microsoft Access, Microsoft SQL Server, Excel and text files or ODBC Report summary cross-tabs Charts Publish reports easily across the web Drag and Drop report creation No complex programming required Export reports to popular formats like xls pdf rtf Print Professional looking reports Database Reporting Tool for...
Category: Software Development / Misc. Programming
Publisher: AEDOS SOFTWARE, License: Freeware, Price: USD $0.00, File Size: 466.0 KB
Platform: Windows
Distribution Guide is a program allowing to build various graphs of statistical distributions.
Distribution Guide is a program allowing to build various Graphs of statistical distributions. It enables you to enter the parameters of the particular distribution and display the Graphs of such functions as PDF, CDF, and others. Printing support is provided as well.
Supported distributions:
- Exponential
- Lognormal
- Normal
- Weibull
-...
Category: Home & Education / Mathematics
Publisher: MathWave Technologies, License: Freeware, Price: USD $0.00, File Size: 1.1 MB
Platform: Windows
FCharts SE is a free stock charting program which will import price data from a wide range of sources, displaying it as OHLC, Candlestick and Line Charts. It has a number of built-in indicators (MACD, RSI, Exponential and Standard Moving Averages), or you can write your own with the inbuilt formula language and display them as standalone Charts or overlays. You can draw trend...
Category: Business & Finance / Business Finance
Publisher: Spacejock Software, License: Freeware, Price: USD $0.00, File Size: 3.1 MB
Platform: Windows
anywhere add-in for Microsoft Excel.
anywhere add-in for Microsoft Excel. Save, retrieve and share your Excel files directly from microsoft Excel with our fully intergrated add-in.
Category: Business & Finance / Applications
Publisher: anywhereenterprises.com, License: Freeware, Price: USD $0.00, File Size: 4.2 MB
Platform: Windows, Mac, 2K, 2K3
Excel Merger can add up specified cells in different Excel File.
Excel Merger can add up specified cells in different Excel File. When you have lots of Excel files with the same format, such as some sale workbooks from the branches of your company. How to add up each cell in all the workbooks? (For example, How to add up all ‘A1’ cells of all workbooks.) Excel Merger can do this for you. You only need to follow 4...
Category: Business & Finance / Applications
Publisher: Bannasoft, License: Freeware, Price: USD $0.00, File Size: 0
Platform: Windows
MB Vedic Astrology Divisional Charts is an advanced yet simple software based on the principles of Indian Astrology. It gives an insight into the Rashi Chart of a person along with his/her Divisional Charts. The Vedic Divisional Charts or the Vargas is widely used for the purpose of interpreting the natal chart of an individual to give more details about houses and their...
Category: Home & Education / Religion & Spirituality
Publisher: MysticBoard.com, License: Freeware, Price: USD $0.00, File Size: 1.5 MB
Platform: Windows
FusionCharts Free is a flash charting component that can be used to render data-driven & animated Charts for your web applications and presentations. It is a cross-browser and cross-platform solution that can be used with ASP.NET, ASP, PHP, JSP, ColdFusion, Ruby on Rails, simple HTML pages or even PowerPoint Presentations to deliver interactive and powerful flash Charts. You...
Category: Software Development / Components & Libraries
Publisher: InfoSoft Global (P) Ltd., License: Freeware, Price: USD $0.00, File Size: 2.7 MB
Platform: Windows, Mac, Linux,
The HBU is an Hymedis client application that allows you to present the Hymedis information on Graphs and as normal data. Different Hymedis parameters can be presented as Graphs or as updated data.
In different tabs a user can select parameter combinations and, when a connection is established, every minute the latest data is picked up from the central server in Vlissingen....
Category: Multimedia & Design / Multimedia App's
Publisher: HBU, License: Freeware, Price: USD $0.00, File Size: 51.6 MB
Platform: Windows
FCharts SE is a free stock charting program which will import price data from a wide range of sources, displaying it as OHLC, Candlestick and Line Charts. It has a number of built-in indicators (MACD, RSI, Exponential and Standard Moving Averages), or you can write your own with the inbuilt formula language and display them as standalone Charts or overlays. You can draw trend...
Category: Business & Finance / Business Finance
Publisher: Spacejock Software, License: Freeware, Price: USD $0.00, File Size: 3.1 MB
Platform: Windows, Vista