Free Downloads: Gantt Bar Graph
License: All | Free
 Freeware
Free Graph Generator is a simple bar chart generation tool that lets you create custom bar charts of any size. Edit bar color, bar width, bar title, and bar side label properties.
Category: Home & Education / Mathematics
Publisher: Innovative Creations Software, License: Freeware, Price: USD $0.00, File Size: 16.5 MB
Platform: Windows
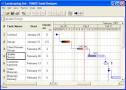
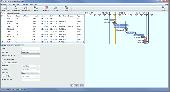
How can a business proposal be taken seriously if it does not contain a graphical presentation of your schedules or activities? If you need a nice Gantt chart fast to demonstrate that you have done due dilligence, Gantt Designer is the tool for you. Most acknowledge that Microsoft Project is too difficult to use if all you want is a nice-looking Gantt chart. There...
Category: Business & Finance
Publisher: Timios Ideas LLP, License: Freeware, Price: USD $0.00, File Size: 488.3 KB
Platform: Windows
We have invested 3 years into developing our Excel Gantt Chart templates incorporating the requirements of hundreds of customers. Whilst our solutions look simple and are easy to use, they are the most powerful, professional Gantt Chart templates available.
After years in senior Project Management roles, the founder of Chart Gantt, Marcus Tarrant, found that most...
Category: Business & Finance / Project Management
Publisher: Chartgantt.com, License: Freeware, Price: USD $0.00, File Size: 466.0 KB
Platform: Windows, Mac
Graph Studio is the open source graph drawing/processing software.
Graph Studio is the open source Graph drawing/processing software. It allows users to build and process highly customizable graphs.
Category: Multimedia & Design
Publisher: sourceforge.net, License: Freeware, Price: USD $0.00, File Size: 118.0 KB
Platform: Windows, Mac, Vista
SBHistogram generates simple histograms from simple ASCII data files.
SBHistogram generates simple histograms from simple ASCII data files. It's a simple tool designed to be easy to use.
A histogram is a chart in which data values in counted and placed into buckets. For example, let's assume you want to do a histogram of peoples ages. Then you might want to use buckets such as 1-10 years, 11-20 years, 21-30 years, etc. Each bucket counts the...
Category: Multimedia & Design / Multimedia App's
Publisher: SB-Software, License: Freeware, Price: USD $0.00, File Size: 604.0 KB
Platform: Windows
Create project schedules and plan task assignments. Create follow-up lists. Display Gantt charts. Manage work loads. Define project tasks, task durations, dependencies, start dates, holidays, and normal work hours. Calculate task end dates and float. Reuse template projects. Define parent and child tasks. Mix daily, weekly, and monthly time scales in the same report. Color code...
Category: Business & Finance
Publisher: Brian C. Christensen, License: Freeware, Price: USD $0.00, File Size: 3.8 MB
Platform: Windows, Mac, Linux
Graph constructs, visualizes and modifies graphs as well as calculates measures and layouts.
Graph constructs, visualizes and modifies graphs as well as calculates measures and layouts.
CoSBiLab Graph can construct, visualize and modify graphs as well as calculate measures and layouts. CoSBiLab Graph can import and export data in a variety of formats, among which the reaction network generated by the beta WorkBench.
Category: Multimedia & Design / Multimedia App's
Publisher: CoSBi, License: Freeware, Price: USD $0.00, File Size: 3.1 MB
Platform: Windows
DataPlot is a program where you can import your time based data and graph it.
DataPlot is a program where you can import your time based data and Graph it.You can move easily back and forward in user defined time window, allows individual time setting for each Graph, values read directly in Graph by dragging mouse over the curve and much more
Category: Multimedia & Design / Multimedia App's
Publisher: CBIM, License: Freeware, Price: USD $0.00, File Size: 311.0 KB
Platform: Windows
Drawing graphs without the right tool is simply difficult.
Drawing graphs without the right tool is simply difficult. uDraw(Graph) automates this task for you. Find out how uDraw(Graph) creates your flow charts, diagrams, hierarchies or structure visualizations using automatic layout - much faster than with any standard drawing program. With the API, uDraw(Graph) can even be embedded in your own programs as a visualization component.
Category: Multimedia & Design / Image Editing
Publisher: University Bremen, FB3, Germany, License: Freeware, Price: USD $0.00, File Size: 2.6 MB
Platform: Windows
Create project schedules and plan task assignments. Create follow-up lists. Display Gantt charts. Manage work loads. Define project tasks, task durations, dependencies, start dates, holidays, and normal work hours. Calculate task end dates and float. Reuse template projects. Define parent and child tasks. Mix daily, weekly, and monthly time scales in the same report. Color code...
Category: Business & Finance
Publisher: Brian C. Christensen, License: Freeware, Price: USD $0.00, File Size: 11.4 MB
Platform: Mac
The Exontrol's ExGantt component is the approach to create timeline charts (also known as Gantt charts). Gantt chart is a time-phased graphic display of activity durations. Activities are listed with other tabular information on the left side with time intervals over the bars. Activity durations are shown in the form of horizontal bars. The exGantt component lets the user...
Category: Utilities / Misc. Utilities
Publisher: Exontrol, License: Freeware, Price: USD $0.00, File Size: 18.0 MB
Platform: Windows
The WebViewer plug-in enables Windows users whether or not they have SigmaPlot to explore the data used to create the Graph.
Using the WebViewer plug-in with your Web browser window you can:
- View the data used to create the Graph
- Print a Graph in a web document at full resolution
- Zoom in and out of a Graph
- Grab and...
Category: Multimedia & Design / Graphics Viewers
Publisher: SYSTAT Software Inc., License: Freeware, Price: USD $0.00, File Size: 12.6 MB
Platform: Windows
With The Option Strategy Builder you could pick up an option and place it directly to the return Graph. As with the online tool, just drag and drop the option on the Graph, and build your strategy. Using your mouse, the options can be easily moved on the Graph to different strike prices, and to different expiration dates.
With this program you can manage your...
Category: Multimedia & Design / Multimedia App's
Publisher: SamoaSky, License: Freeware, Price: USD $0.00, File Size: 3.1 MB
Platform: Windows

Archim is a program for drawing the graphs of all kinds of functions. You can define a Graph explicitly and parametrically, in polar and spherical coordinates, on a plane and in space (surface). Archim will be useful for teachers and students, as well as for everyone who is interested min geometry. With Archim, you will draw the Graph of any function and form, just use your...
Category: Home & Education
Publisher: Stochastic Lab, License: Freeware, Price: USD $0.00, File Size: 479.6 KB
Platform: Windows
Graph-A-Ping allows you to visually see the ping latency between ping times.
Graph-A-Ping allows you to visually see the ping latency between ping times. The bigger the gap between one ping to another allows you to spot possible network bottle neck.
This tool is actually an applet part of Glass Net Networks monitoring console.
Category: Internet / Misc. Plugins
Publisher: Mataluis.Com, License: Freeware, Price: USD $0.00, File Size: 2.1 MB
Platform: Windows
Graph Extract is a program for digitizing plots.
Graph Extract is a program for digitizing plots. Using either manual or automated approaches, this program provides a means to easily extract numeric data from plots. The resulting X-Y data can be printed or replotted, or it can be saved in Excel file for
Category: Multimedia & Design
Publisher: quadtechassociates.com, License: Freeware, Price: USD $0.00, File Size: 446.0 KB
Platform: Windows
Graph visualization is a way of representing structural information as diagrams of abstract graphs and networks. Automatic Graph drawing has many important applications in software engineering, database and web design, networking, and in visual interfaces
Category: Multimedia & Design
Publisher: graphviz.org, License: Freeware, Price: USD $0.00, File Size: 26.6 MB
Platform: Windows, Mac, Vista
The NetGraph – network monitor 2.
The NetGraph – network monitor 2.0 is a software network-monitoring program that enables users to see at a glance the activities on their networks including the volumes of traffic with four simple Graph mode indicators.
The program works on any Windows’ network connection and NetGraph – network monitor 2.0’s four modes include 2 snapshot modes and 2...
Category: Internet / Monitoring
Publisher: Nikola Dachev, License: Freeware, Price: USD $0.00, File Size: 0
Platform: Windows
MathTrax is a graphing tool for middle school and high school students to Graph equations, physics simulations or plot data files.
The graphs have descriptions and sound so you can hear and read about the Graph. Blind and low vision users can access visual math data and Graph or experiment with equations and datasets.
Category: Business & Finance / Applications
Publisher: The MathTrax Team, License: Freeware, Price: USD $0.00, File Size: 21.0 MB
Platform: Windows
Feathers :
These are overall features of XP Lan Pro 3.
Feathers :
These are overall features of XP Lan Pro 3.3 (Beta).
XP Lan Pro 3.3 (Beta) can determine following things.
IP address of your computer,
MAC address of LAN card,
Host Name Determination,
Subnet Mask of your network,
DNS Server,
DHCP Server,
Incomming Bytes Per Second,
Outgoing Bytes Per Second,
Incomming Bytes per second...
Category: Internet / News Applications
Publisher: Apnasoft, License: Freeware, Price: USD $0.00, File Size: 2.0 MB
Platform: Windows
RJS Graph produces professional scientific and mathematical graphs.
RJS Graph produces professional scientific and mathematical graphs. You may study the data with a wide range of data analysis tools. Features include the ability to plot data and equations, fit best fit curves and splines, and display fitted best fit curve parameters. Data can be pasted from a spreadsheet or imported from a text file using a wizard.
Category: Home & Education / Mathematics
Publisher: RJS, License: Freeware, Price: USD $0.00, File Size: 3.7 MB
Platform: Windows
Quickly master project objectives and goals with this free Windows software. Express Project is a free project management software program to help you monitor and track all project activities and help you stay on track to achieve established goals. Gantt charts are used for current status of project's scope, time, quality and budget constraints. Express Project Management Free...
Category: Business & Finance / Project Management
Publisher: NCH Software, License: Freeware, Price: USD $0.00, File Size: 289.1 KB
Platform: Windows
Quickly master project objectives and goals with this free Windows software. Express Project is a free project management software program to help you monitor and track all project activities and help you stay on track to achieve established goals. Gantt charts are used for current status of project's scope, time, quality and budget constraints. Express Project Features:...
Category: Business & Finance / Project Management
Publisher: NCH Software, License: Freeware, Price: USD $0.00, File Size: 284.1 KB
Platform: Windows
T&D Graph has been designed as a user friendly software which brings users even more effective tools for the management and analysis of data recorded by T&D Data Loggers. It contains a variety of useful functions including the ability to read and merge multiple data files and display recorded data in Graph and/or list form.
Category: Software Development / Misc. Programming
Publisher: T&D CORPORATION, License: Freeware, Price: USD $0.00, File Size: 11.3 MB
Platform: Windows
Gantt chart and project tracking tool, nice look, screen export (.jpg), XML file format, resources and asignations, simple but powerful. No install required when using Java Web Start: http://ghannid.homeip.net/lgantt/lgantt.jnlp (but you will have to accept the java security check).
Category: Business & Finance
Publisher: Carlos Silva A., License: Freeware, Price: USD $0.00, File Size: 263.7 KB
Platform: Windows, Linux, Unix
Freeware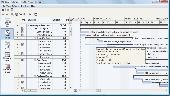
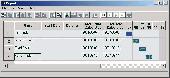
MOOS Project Viewer is a free Microsoft Project viewer that can open any MS Project file type (.mpp, .mpt, .mpx, .xml) for any Microsoft Project version (2000, 2003 and 2007). Available views: WBS, Gantt chart, task sheet, resource sheet, resource usage. It is running on any Java enabled platform including Windows, Mac OS X and Linux and it is the perfect solution for project...
Category: Business & Finance / Project Management
Publisher: MS Project Viewer, License: Freeware, Price: USD $0.00, File Size: 9.4 MB
Platform: Windows
FC_RTGraph is a tool that allows you to collect and graph information from SNMP devices.
FC_RTGraph is a tool that allows you to collect and Graph information from SNMP devices. FC_RTGraph takes an XML formatted config file as input. FC_RTGraph is an excellent tool for real-time monitoring. Collected SNMP data can be graphed in highly customizable 3D graphs (Bar, Area, Line, 3D). FC_RTGraph can be run on Microsoft Windows 2000/2003, XP and Vista. FC_RTGraph supports...
Category: Internet / Monitoring
Publisher: Finnleys, License: Freeware, Price: USD $0.00, File Size: 1.7 MB
Platform: Windows
Function Analyzer is a program that draws the Graph of a function with one variable declared by the user. The operators used to build the mathematical expression are the usual ones used in software calculators: * for multiplying, / for dividing, ^ for power and so on. Parentheses can be used to group terms in your expression. Trigonometric functions are also supported, along with a few...
Category: Home & Education / Mathematics
Publisher: Lorenzi Davide, License: Freeware, Price: USD $0.00, File Size: 1.3 MB
Platform: Windows

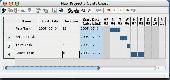
Quickly master project objectives and goals with this free Mac software. Express Project Free for Mac is a free project management software program to help you monitor and track all project activities and help you stay on track to achieve established goals. Gantt charts are used for current status of project's scope, time, quality and budget constraints. Express Project...
Category: Business & Finance / Project Management
Publisher: NCH Software, License: Freeware, Price: USD $0.00, File Size: 708.0 KB
Platform: Mac
JGraph is the leading Open Source Java Graph Visualization Library.
JGraph is the leading Open Source Java Graph Visualization Library. It follows Swing design patterns to provide an API familiar to Swing programmers and functionality that provides a range of features. Graph visualization is a central requirement for applications such as workflow editors, computer and telecommunication networks display, flowcharts, VLSI and CAD, business process...
Category: Software Development / Components & Libraries
Publisher: JGraph Ltd, License: Freeware, Price: USD $0.00, File Size: 136.0 KB
Platform: Windows, Linux, Mac
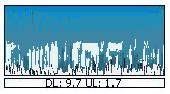
BitMeter 2 is a bandwidth meter, it allows you to visually monitor your internet connection by displaying a scrolling Graph that shows your upload and download speed over time. BitMeter is freeware - ie. it is given away completely free of charge, there is no trial period, no time-limited features, no spyware, and no adware, guaranteed. BitMeter displays a coloured...
Category: Internet
Publisher: Codebox Software, License: Freeware, Price: USD $0.00, File Size: 1017.3 KB
Platform: Windows
BitMeter 2 is a bandwidth meter, it allows you to visually monitor your internet connection by displaying a scrolling Graph that shows your upload and download speed over time. BitMeter is freeware - ie. it is given away completely free of charge, there is no trial period, no time-limited features, no spyware, and no adware, guaranteed. BitMeter displays a coloured Graph showing...
Category: Internet / Monitoring
Publisher: Codebox Software, License: Freeware, Price: USD $0.00, File Size: 1013.8 KB
Platform: Windows

Obtain data from images of graphs scanned from articles or available as image. Import the Graph into ScanIt from a scanner or file, or from the clipboard. Define locations of the Graph's axes by indicating known points. Extract data from the Graph by manually picking points, by scanning for points or by scanning along curves. Copy the scanned data to Excel or export data to...
Category: Home & Education / Science
Publisher: amsterchem, License: Freeware, Price: USD $0.00, File Size: 6.1 MB
Platform: Windows
Ganttsoft Project Manager is a small application for project management.
Ganttsoft Project Manager is a small application for project management. It allows users to arrange their tasks in a Gantt chart and to manage the resources assigned to each task.
The Gantt chart is the most popular schedule form used for project management. It displays the starting and ending date of each task, tasks connections, milestones, and dependencies between the...
Category: Business & Finance / Project Management
Publisher: Ganttsoft, License: Freeware, Price: USD $0.00, File Size: 2.1 MB
Platform: Windows
This is a simple PID simulator I wrote in .
This is a simple PID simulator I wrote in .NET, created to get a feel of how to tune a PID by adjusting the various properties.
Features:
- pid-simulator-v1.0.0.6.zip contains the installer
- Real-time temperature Graph
- Visualized power output and error (with color and Bar size)
- Adjustable heat capacity
Category: Games / Simulations
Publisher: staplerfahrer, License: Freeware, Price: USD $0.00, File Size: 327.2 KB
Platform: Windows
MuvEnum Address Bar is the ultimate replacement for the missing address bar in Windows XP SP3.
MuvEnum Address Bar is the ultimate replacement for the missing address Bar in Windows XP SP3. It recreates the experience of the original address Bar with auto-completion while adding many new features that allow you to quickly open webpages, navigate to favorites, start programs, search the internet, and more from you Windows Taskbar! Supports the original address...
Category: Utilities / Launchers
Publisher: MuvEnum, License: Freeware, Price: USD $0.00, File Size: 573.4 KB
Platform: Windows
Biorhytm is a small application that generates your biorhytm status.
Biorhytm is a small application that generates your biorhytm status.
Enter your birthday and a Graph will reveal your
bio health, with charts and lines displaying your physical, intellectual and emotional state as well. You can save result Graph to BMP file.
Category: Home & Education / Astrology & Numerology
Publisher: aOlej, License: Freeware, Price: USD $0.00, File Size: 389.0 KB
Platform: Windows
iTraffic Monitor is a network monitor and reporting tool.
iTraffic Monitor is a network monitor and reporting tool. It provides real time Graph of network traffic. Detailed stats provide daily/weekly/monthly/yearly stats.
Main features:
- Monitor and review your Internet or network bandwidth usage with ease.
- How fast your internet connection? We can Graph it for your review.
- How much data do yo u...
Category: Internet / Monitoring
Publisher: Charles DeWeese, License: Freeware, Price: USD $0.00, File Size: 1.1 MB
Platform: Windows
PeCo-Graph is the software for the procurement and graphical visualisation of the counting data from one or multiple PeCo range units. An easy-to-use application for PC that eases the download of the counting data and simplifies their analysis and graphical representation.
It has multiple charts to easily make presentations, for instance, with comparisons of the data acquired in...
Category: Business & Finance / Business Finance
Publisher: Visual Tools S.A., License: Freeware, Price: USD $0.00, File Size: 3.3 MB
Platform: Windows
This free program plots in realtime all data sent and received using the Dial-Up Networking Adapter and Modem. Shows separate sent, received, send rate, received rate, peaks and totals. Five graphs and statistics. Animated System Tray Icon. Allows you to change colours, Graph size, sample seconds, 3D Graph, axis and more. Full automated self-upgrade. Autostart with Win95/98. Now...
Category: Internet / Dial-up & Connectivity
Publisher: Ashok Kumar Parmar, License: Freeware, Price: USD $0.00, File Size: 819.2 KB
Platform: Windows
Title Bar Reader is a freeware that can subtly display texts in the title Bar of your foreground active window. There are ample short texts that come with the program by default: these include quotes, proverbs, funny jokes, health tips, language vocabularies, bible and more. You can easily edit existing files and add or remove information. The program is very useful when you want...
Category: Home & Education / Miscellaneous
Publisher: MPC soft, License: Freeware, Price: USD $0.00, File Size: 0
Platform: Windows
Free Launch Bar is a Free replacement for the standard Quick Launch bar.
Free Launch Bar is a Free replacement for the standard Quick Launch Bar. All functions presented in Quick Launch are also in Free Launch Bar. However, the Free Launch Bar is fully compatible with Quick Launch because it uses the same folder for shortcuts. But there is one huge difference. Free Launch Bar allows you to combine your shortcuts into groups. This...
Category: Utilities / Launchers
Publisher: TrueSoft, License: Freeware, Price: USD $0.00, File Size: 522.2 KB
Platform: Windows
A small tool written in Python with the PyQt toolkit that scrapes the HTML usage page and extracts the relevent usage information. This information is presented with a nice progress Bar to convey the current quota usage.
One of the most important features of GetUsage is the ability to show a breakdown of internet usage on a per day basis through the use of a Graph.
...
Category: Internet / Misc. Plugins
Publisher: Simon Allen, License: Freeware, Price: USD $0.00, File Size: 7.1 MB
Platform: Windows
The Library GraphDiag is intended for building Graph and diagrams on HBITMAP, surface DirectDraw and in file BMP format. The Library can build the graphs on entered text line and diagrams, as from tables, which format is provided by developer, so and from files HTML-format and from XLS files Excel. Given version first and is not deprived defect and restrictions. The Restrictions are of...
Category: Software Development / Components & Libraries
Publisher: Kruchinin Aleksandr, License: Freeware, Price: USD $0.00, File Size: 67.0 KB
Platform: Windows
Atlantis Schema Surf is our SQL dependency & live entity ER diagram tool - it is a free animated graphing tool which allows you to easily visualize the dependencies between the objects in your SQL Server databases in a live entity ER diagram.
Schema Surf, like it's counterpart Data Surf, contains a "Surf Graph" which allows you to easily view an object and the...
Category: Business & Finance / Database Management
Publisher: Atlantis Interactive UK Ltd., License: Freeware, Price: USD $0.00, File Size: 7.4 MB
Platform: Windows
WTides is a free program that uses harmonics data to predict tide heights at many locations throughout the World, and displays a Graph of the results according to the time zone of the target location. The tide Graph can be overlaid with a solunar chart to give an interesting version of the Maori Fishing Calendar. The program runs on any version of Microsoft Windows from Windows 95.
Category: Multimedia & Design / Digital Media Editors
Publisher: Managing Data Resources (NZ) Ltd, License: Freeware, Price: USD $0.00, File Size: 601.9 KB
Platform: Windows
HTML Source Bar is an Internet Explorer 5 (or better) Explorer Bar that shows you the source contents of the viewed HTML pages.
An Explorer Bar integrates directly into the Internet Explorer workspace. This one presents the hierarchy of elements contained in the currently viewed web page.
The HTML source code can be viewed, as well any scripting code...
Category: Internet / Browser Accessories
Publisher: viksoe, License: Freeware, Price: USD $0.00, File Size: 282.1 KB
Platform: Windows
Freeware
The Smart Address Bar suggests cool sites and related search terms while you type. Use your address Bar like a search engine and get keyword recommendations as you type. Simply enter a few letters in your address Bar, and the Smart Address Bar will do the rest of the work for you by predicting the keyword you are typing or the website you are trying to visit!
Category: Internet / Web Search Utilities
Publisher: Think Tank Labs, License: Freeware, Price: USD $0.00, File Size: 367.0 KB
Platform: Windows
GraphSight Junior is an easy to use freeware handy 2D math-graphing program.
GraphSight Junior is an easy to use freeware handy 2D math-graphing program. It was originally designed to help students and teachers satisfy their day-after-day math plotting needs. It makes it easy to plot and explore common Y(X) = F(X) Cartesian graphs, set text labels on the coordinate plane, zoom or shift a Graph with just a single click & move of mouse. The resulting picture...
Category: Home & Education / Miscellaneous
Publisher: CradleFields.com, License: Freeware, Price: USD $0.00, File Size: 393.0 KB
Platform: Windows