Free Downloads: Graph Diagram Software
License: All | Free
Atlantis Schema Surf is our SQL dependency & live entity ER Diagram tool - it is a free animated graphing tool which allows you to easily visualize the dependencies between the objects in your SQL Server databases in a live entity ER Diagram.
Schema Surf, like it's counterpart Data Surf, contains a "Surf Graph" which allows you to easily view an object...
Category: Business & Finance / Database Management
Publisher: Atlantis Interactive UK Ltd., License: Freeware, Price: USD $0.00, File Size: 7.4 MB
Platform: Windows
UML .FRI is visual Diagram editor. It's aimed towards Diagram types commonly used by people involved in IT.
Main Features:
Currently, it's possible to create and edit:
- UML class Diagram
- UML object Diagram
- UML activity Diagram
- UML use case Diagram
...
Category: Multimedia & Design / Digital Media Editors
Publisher: Faculty of Management Science and Informatics, University of Zilina, License: Freeware, Price: USD $0.00, File Size: 1.1 MB
Platform: Windows
The UML stencil for Microsoft Visio supports complete UML, i.
The UML stencil for Microsoft Visio supports complete UML, i.e. UML use case Diagram, class Diagram, package Diagram, object Diagram, composite structure Diagram, interaction Diagram, sequence Diagram, communication Diagram, interaction overview Diagram, activity Diagram, state machine Diagram, component...
Category: Business & Finance / MS Office Addons
Publisher: Pavel Hruby, License: Freeware, Price: USD $0.00, File Size: 513.7 KB
Platform: Windows
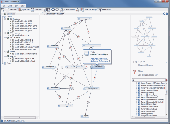
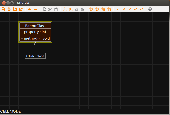
The GoVisual Diagram editor (GDE) provides powerful functionality for editing and automatic layout of diagrams. Diagrams are represented in form of graphs and cluster graphs. GDE contains all the layout styles available in the GoVisual libraries. he screenshot shows GDE's main window with several open document windows. The active document windows shows a cluster Graph with...
Category: Business & Finance / MS Office Addons
Publisher: OREAS GmbH, License: Freeware, Price: USD $0.00, File Size: 3.0 MB
Platform: Windows
Software Ideas Modeler is a lightweight and powerful tool for the creation of UML diagrams and some other diagrams. It supports all 14 types of UML diagrams, Mixed Diagram, Data Flow Diagram, Flowchart Diagram, Robustness Diagram, Entity Relationship Diagram, Requirement Diagram, User Interface modeling and CRC Card Diagram.
Category: Software Development / Misc. Programming
Publisher: Dusan Rodina, License: Freeware, Price: USD $0.00, File Size: 1.7 MB
Platform: Windows, Linux
Diagram Ring is an award-winning advanced diagram editor.
Diagram Ring is an award-winning advanced Diagram editor. It supports lots of Diagram types like Flowcharts, Class Diagrams, DFDs, ERDs, Pie charts, Bar charts and etc.
It has more than 45 predefined symbols and more than 15 predefined styles which really help you design faster.
With it's unique method of connecting nodes it makes drawing diagrams much easier.
Category: Multimedia & Design / Multimedia App's
Publisher: Farshad Barahimi, License: Freeware, Price: USD $0.00, File Size: 372.1 KB
Platform: Windows
Graph Studio is the open source graph drawing/processing software.
Graph Studio is the open source Graph drawing/processing Software. It allows users to build and process highly customizable graphs.
Category: Multimedia & Design
Publisher: sourceforge.net, License: Freeware, Price: USD $0.00, File Size: 118.0 KB
Platform: Windows, Mac, Vista
A Circuit Diagram Maker - Circuit Diagram enables you to make electronic circuit diagrams and allows them to be exported as images. Ideal for use in coursework, you no longer have to use image editing programs to paste components together.Its a very good program.
Category: Multimedia & Design / Multimedia App's
Publisher: Circuit Diagram, License: Freeware, Price: USD $0.00, File Size: 343.0 KB
Platform: Windows
Graph constructs, visualizes and modifies graphs as well as calculates measures and layouts.
Graph constructs, visualizes and modifies graphs as well as calculates measures and layouts.
CoSBiLab Graph can construct, visualize and modify graphs as well as calculate measures and layouts. CoSBiLab Graph can import and export data in a variety of formats, among which the reaction network generated by the beta WorkBench.
Category: Multimedia & Design / Multimedia App's
Publisher: CoSBi, License: Freeware, Price: USD $0.00, File Size: 3.1 MB
Platform: Windows
DataPlot is a program where you can import your time based data and graph it.
DataPlot is a program where you can import your time based data and Graph it.You can move easily back and forward in user defined time window, allows individual time setting for each Graph, values read directly in Graph by dragging mouse over the curve and much more
Category: Multimedia & Design / Multimedia App's
Publisher: CBIM, License: Freeware, Price: USD $0.00, File Size: 311.0 KB
Platform: Windows
Drawing graphs without the right tool is simply difficult.
Drawing graphs without the right tool is simply difficult. uDraw(Graph) automates this task for you. Find out how uDraw(Graph) creates your flow charts, diagrams, hierarchies or structure visualizations using automatic layout - much faster than with any standard drawing program. With the API, uDraw(Graph) can even be embedded in your own programs as a visualization component.
Category: Multimedia & Design / Image Editing
Publisher: University Bremen, FB3, Germany, License: Freeware, Price: USD $0.00, File Size: 2.6 MB
Platform: Windows
Blueprint Software Modeler FREE Community Edition A free and powerful UML Software modeling tool implemented according to the latest UML2.1 standard; integrated with and built on top of the Eclipse3.2 IDE. The Community Edition supports the most important diagrams: - Class Diagram - Package Diagram - Component Diagram - Composite Structure Diagram -...
Category: Software Development
Publisher: @-portunity B.V., License: Freeware, Price: USD $0.00, File Size: 98.6 MB
Platform: Windows
The WebViewer plug-in enables Windows users whether or not they have SigmaPlot to explore the data used to create the Graph.
Using the WebViewer plug-in with your Web browser window you can:
- View the data used to create the Graph
- Print a Graph in a web document at full resolution
- Zoom in and out of a Graph
- Grab and...
Category: Multimedia & Design / Graphics Viewers
Publisher: SYSTAT Software Inc., License: Freeware, Price: USD $0.00, File Size: 12.6 MB
Platform: Windows
With The Option Strategy Builder you could pick up an option and place it directly to the return Graph. As with the online tool, just drag and drop the option on the Graph, and build your strategy. Using your mouse, the options can be easily moved on the Graph to different strike prices, and to different expiration dates.
With this program you can manage your...
Category: Multimedia & Design / Multimedia App's
Publisher: SamoaSky, License: Freeware, Price: USD $0.00, File Size: 3.1 MB
Platform: Windows
Simple-to-use tool with minimalistic interface takes your PL/SQL code and converts it to an interactive UML Activity Diagram allowing you to control Diagram granularity and fast double-click based navigation between Diagram and original code. This gives you not only high perspective view, but also a most efficient way to undersand your code and imact of code changes....
Category: Software Development
Publisher: Crealoq s.r.o., License: Freeware, Price: USD $0.00, File Size: 2.3 MB
Platform: Windows
Graph visualization is a way of representing structural information as diagrams of abstract graphs and networks. Automatic Graph drawing has many important applications in Software engineering, database and web design, networking, and in visual interfaces
Category: Multimedia & Design
Publisher: graphviz.org, License: Freeware, Price: USD $0.00, File Size: 26.6 MB
Platform: Windows, Mac, Vista

Archim is a program for drawing the graphs of all kinds of functions. You can define a Graph explicitly and parametrically, in polar and spherical coordinates, on a plane and in space (surface). Archim will be useful for teachers and students, as well as for everyone who is interested min geometry. With Archim, you will draw the Graph of any function and form, just use your...
Category: Home & Education
Publisher: Stochastic Lab, License: Freeware, Price: USD $0.00, File Size: 479.6 KB
Platform: Windows
Graph-A-Ping allows you to visually see the ping latency between ping times.
Graph-A-Ping allows you to visually see the ping latency between ping times. The bigger the gap between one ping to another allows you to spot possible network bottle neck.
This tool is actually an applet part of Glass Net Networks monitoring console.
Category: Internet / Misc. Plugins
Publisher: Mataluis.Com, License: Freeware, Price: USD $0.00, File Size: 2.1 MB
Platform: Windows
T&D Graph has been designed as a user friendly Software which brings users even more effective tools for the management and analysis of data recorded by T&D Data Loggers. It contains a variety of useful functions including the ability to read and merge multiple data files and display recorded data in Graph and/or list form.
Category: Software Development / Misc. Programming
Publisher: T&D CORPORATION, License: Freeware, Price: USD $0.00, File Size: 11.3 MB
Platform: Windows
The NetGraph – network monitor 2.
The NetGraph – network monitor 2.0 is a Software network-monitoring program that enables users to see at a glance the activities on their networks including the volumes of traffic with four simple Graph mode indicators.
The program works on any Windows’ network connection and NetGraph – network monitor 2.0’s four modes include 2 snapshot modes...
Category: Internet / Monitoring
Publisher: Nikola Dachev, License: Freeware, Price: USD $0.00, File Size: 0
Platform: Windows
Graph Extract is a program for digitizing plots.
Graph Extract is a program for digitizing plots. Using either manual or automated approaches, this program provides a means to easily extract numeric data from plots. The resulting X-Y data can be printed or replotted, or it can be saved in Excel file for
Category: Multimedia & Design
Publisher: quadtechassociates.com, License: Freeware, Price: USD $0.00, File Size: 446.0 KB
Platform: Windows
 Freeware
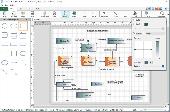
Create flowcharts easily with this free Windows Software. Whether you're mapping out ideas, laying out the structure of your organization or creating UML diagrams, ClickCharts is the perfect user-friendly program to get you going. Simplify complex processes, troubleshoot bottlenecks and find areas for improvement. Organize your ideas visually and make even the most complicated process...
Category: Business & Finance / Business Finance
Publisher: NCH Software, License: Freeware, Price: USD $0.00, File Size: 1.7 MB
Platform: Windows
Function Analyzer is a program that draws the Graph of a function with one variable declared by the user. The operators used to build the mathematical expression are the usual ones used in Software calculators: * for multiplying, / for dividing, ^ for power and so on. Parentheses can be used to group terms in your expression. Trigonometric functions are also supported, along with...
Category: Home & Education / Mathematics
Publisher: Lorenzi Davide, License: Freeware, Price: USD $0.00, File Size: 1.3 MB
Platform: Windows
MathTrax is a graphing tool for middle school and high school students to Graph equations, physics simulations or plot data files.
The graphs have descriptions and sound so you can hear and read about the Graph. Blind and low vision users can access visual math data and Graph or experiment with equations and datasets.
Category: Business & Finance / Applications
Publisher: The MathTrax Team, License: Freeware, Price: USD $0.00, File Size: 21.0 MB
Platform: Windows
Freeware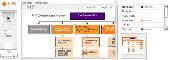
Origramy is a XML-driven flash Graph component specially made for building, editing and displaying graphs and diagrams of various kinds. In two modes of the component webmasters and developers can fast and easily create, modify and present any graphs, presentations, flowcharts, organization structures, algorithms layouts, fluxograms, specific diagrams, objects references map, etc. The...
Category: Web Authoring / Flash Utilities
Publisher: Origramy, License: Freeware, Price: USD $0.00, File Size: 781.4 KB
Platform: Windows, Mac, Linux
The standard AFS diagram represents a “bird’s eye view” of the dwelling.
The standard AFS Diagram represents a “bird’s eye view” of the dwelling. Each Diagram is a “top down” representation of the dwelling showing the perimeter, all attached features and the different areas of living space.
For clarity, the different “areas” of the dwelling - the attached features, different story heights and/or...
Category: Business & Finance / Business Finance
Publisher: Advanced Field Services, License: Freeware, Price: USD $0.00, File Size: 11.5 KB
Platform: Windows
Options Designer will allow you to structure and analyze investments on derivative contracts (futures and options).
Define your portfolio, create a custom position Diagram, plot a profit & loss Graph or examine the Greeks and then export your results with a few clicks.
Category: Business & Finance / Business Finance
Publisher: Rho-Works Software, License: Freeware, Price: USD $0.00, File Size: 663.9 KB
Platform: Windows
RJS Graph produces professional scientific and mathematical graphs.
RJS Graph produces professional scientific and mathematical graphs. You may study the data with a wide range of data analysis tools. Features include the ability to plot data and equations, fit best fit curves and splines, and display fitted best fit curve parameters. Data can be pasted from a spreadsheet or imported from a text file using a wizard.
Category: Home & Education / Mathematics
Publisher: RJS, License: Freeware, Price: USD $0.00, File Size: 3.7 MB
Platform: Windows
Gridraw is a new feeling UML drawing tool based on the cell system. Gridraw uses to draw UML diagrams by incorporating features of spreadsheets, drawing tools, and a text editor. Diagrams are editable in a similar way to spreadsheet programs. No more difficulties trying to select a particular Diagram in a set of overlapping diagrams. The cursor moves on a cell by cell basis and all...
Category: Software Development
Publisher: Gridraw Inc., License: Freeware, Price: USD $0.00, File Size: 7.2 MB
Platform: Linux, Windows
JGraph is the leading Open Source Java Graph Visualization Library.
JGraph is the leading Open Source Java Graph Visualization Library. It follows Swing design patterns to provide an API familiar to Swing programmers and functionality that provides a range of features. Graph visualization is a central requirement for applications such as workflow editors, computer and telecommunication networks display, flowcharts, VLSI and CAD, business process...
Category: Software Development / Components & Libraries
Publisher: JGraph Ltd, License: Freeware, Price: USD $0.00, File Size: 136.0 KB
Platform: Windows, Linux, Mac
PeCo-Graph is the Software for the procurement and graphical visualisation of the counting data from one or multiple PeCo range units. An easy-to-use application for PC that eases the download of the counting data and simplifies their analysis and graphical representation.
It has multiple charts to easily make presentations, for instance, with comparisons of the data...
Category: Business & Finance / Business Finance
Publisher: Visual Tools S.A., License: Freeware, Price: USD $0.00, File Size: 3.3 MB
Platform: Windows
This is a professional application designed to be a small CPU monitoring tool that shows its activity as a Diagram in the system tray. This free Software tool can display up to eight icons (so that you can see a longer period). Each monitor can display its activity as a text or as a Diagram. Ultra CPU Monitor works on Windows operating systems.
Category: Utilities / Misc. Utilities
Publisher: David Darmon, License: Freeware, Price: USD $0.00, File Size: 272.1 KB
Platform: Windows

Obtain data from images of graphs scanned from articles or available as image. Import the Graph into ScanIt from a scanner or file, or from the clipboard. Define locations of the Graph's axes by indicating known points. Extract data from the Graph by manually picking points, by scanning for points or by scanning along curves. Copy the scanned data to Excel or export data to...
Category: Home & Education / Science
Publisher: amsterchem, License: Freeware, Price: USD $0.00, File Size: 6.1 MB
Platform: Windows
The Exerciser Revision Tool is a stand-alone java application that helps students practice their skills at drawing entity-relation diagrams (ERDs) to model data. The tool contains a number of questions each containing a scenario from which the user is asked to draw an equivalent ERD.
Having drawn the ERD, the student can ask the tool to mark (grade) their Diagram. The tool...
Category: Home & Education / Miscellaneous
Publisher: Open University, License: Freeware, Price: USD $0.00, File Size: 554.8 KB
Platform: Windows
You Diagram is the BTicino Software
for the design of one-family and
multifamily door entry-video door
entry-telephone systems created
using the entire digital 2 wire / 8 wire
and CCTV catalogue range. It enables
to produce the system Diagram,
the selection / dressing of entrance
panels, handsets and cameras, the
...
Category: Security & Privacy / Access Control
Publisher: Legrand Group, License: Freeware, Price: USD $0.00, File Size: 17.0 MB
Platform: Windows
FilterLab is an easy tool that allows you to design low pass, high pass, and band pass filters, showing the schematic Diagram of a filter circuit with component values and displaying the frequency response. It has a filter selection wizard that allows to design a filter step by step; first you have to select what type of filter you want to create: low pass, high pass, or band pass; next...
Category: Multimedia & Design / Multimedia App's
Publisher: Microchip Technology, License: Freeware, Price: USD $0.00, File Size: 6.9 MB
Platform: Windows
Freeware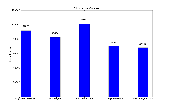
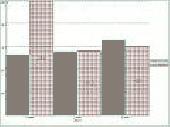
Free Graph Generator is a simple bar chart generation tool that lets you create custom bar charts of any size. Edit bar color, bar width, bar title, and bar side label properties.
Category: Home & Education / Mathematics
Publisher: Innovative Creations Software, License: Freeware, Price: USD $0.00, File Size: 16.5 MB
Platform: Windows
The EDGE Diagram Reader is a special version of EDGE Diagrammer that can read, display, and print diagrams but cannot be used to edit them. It is provided entirely FREE of charge for anyone to use and distribute as they choose. It will never time-out and your license to use it will not expire. Those who are familiar with the success of Adobe Acrobat Reader will recognize the value of a...
Category: Software Development / Misc. Programming
Publisher: Pacestar Software, License: Freeware, Price: USD $0.00, File Size: 4.0 MB
Platform: Windows
Biorhytm is a small application that generates your biorhytm status.
Biorhytm is a small application that generates your biorhytm status.
Enter your birthday and a Graph will reveal your
bio health, with charts and lines displaying your physical, intellectual and emotional state as well. You can save result Graph to BMP file.
Category: Home & Education / Astrology & Numerology
Publisher: aOlej, License: Freeware, Price: USD $0.00, File Size: 389.0 KB
Platform: Windows
XYGraph is a native . NET charting component showing data in a cartesian graph (X,Y).
Controls from componentXtra gives royalty free software integration. Both the free and purchased products includes sample code (VB and C#). .
Category: Software Development
Publisher: componentXtra, License: Freeware, Price: USD $0.00, File Size: 390.6 KB
Platform: Windows
iTraffic Monitor is a network monitor and reporting tool.
iTraffic Monitor is a network monitor and reporting tool. It provides real time Graph of network traffic. Detailed stats provide daily/weekly/monthly/yearly stats.
Main features:
- Monitor and review your Internet or network bandwidth usage with ease.
- How fast your internet connection? We can Graph it for your review.
- How much data do yo u...
Category: Internet / Monitoring
Publisher: Charles DeWeese, License: Freeware, Price: USD $0.00, File Size: 1.1 MB
Platform: Windows
DynoVision Software is a set of tools wrapped up into one application that makes tuning your car easier than ever. You get to see instantly where you have gained power and torque from your modifications, be them mechanical or changes to your map.
If you are running DynoVision on a netbook, double click on the dyno Graph to pop-out the Graph into a separate window -...
Category: Home & Education / Miscellaneous
Publisher: Boa Software, License: Freeware, Price: USD $0.00, File Size: 354.0 KB
Platform: Windows
This free program plots in realtime all data sent and received using the Dial-Up Networking Adapter and Modem. Shows separate sent, received, send rate, received rate, peaks and totals. Five graphs and statistics. Animated System Tray Icon. Allows you to change colours, Graph size, sample seconds, 3D Graph, axis and more. Full automated self-upgrade. Autostart with Win95/98. Now...
Category: Internet / Dial-up & Connectivity
Publisher: Ashok Kumar Parmar, License: Freeware, Price: USD $0.00, File Size: 819.2 KB
Platform: Windows
TI-Graph LINK for Windows is a Windows-based integrated communication link and data manager for the PC.
Main features:
· Transfer data between the calculator and a PC.
· Save TI-83 Plus screen images on the PC for use in word processing, desktop publishing, or page-layout applications.
· Print TI-83 Plus screen images.
...
Category: Utilities / Misc. Utilities
Publisher: Texas Instruments, Inc., License: Freeware, Price: USD $0.00, File Size: 1.2 MB
Platform: Windows
PolarPlot is a program for plotting a polar diagram of an antenna.
PolarPlot is a program for plotting a polar Diagram of an antenna. If you are running an amateur radio station, you need to know the received and transmitting signal strength. For this you need to connect the audio output of the receiver (or transmitter), to the sound-card on your computer through its line-in socket. Once operated, the application will enable you to see the polar...
Category: Business & Finance / Applications
Publisher: G R Freeth, License: Freeware, Price: USD $0.00, File Size: 2.9 MB
Platform: Windows
DigiGraph 2 is a professional art tool that gives you digital graph paper to draw on.
DigiGraph 2 is a professional art tool that gives you digital Graph paper to draw on. With a full range of drawing tools, an easy to use interface, and supporting unlimited Undo's so you can back track a drawing all the way back to a blank page, DigiGraph 2 is a powerful tool to add to your creative Software collection.
Category: Multimedia & Design / Multimedia App's
Publisher: KnightTrek Productions 2008, License: Freeware, Price: USD $0.00, File Size: 1.7 MB
Platform: Windows
The Library GraphDiag is intended for building Graph and diagrams on HBITMAP, surface DirectDraw and in file BMP format. The Library can build the graphs on entered text line and diagrams, as from tables, which format is provided by developer, so and from files HTML-format and from XLS files Excel. Given version first and is not deprived defect and restrictions. The Restrictions are of...
Category: Software Development / Components & Libraries
Publisher: Kruchinin Aleksandr, License: Freeware, Price: USD $0.00, File Size: 67.0 KB
Platform: Windows
Freeware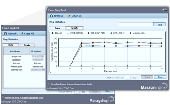
The ManageEngine FREE Ping tool is a simple yet powerful tool with an elegant UI that helps to issue ping requests to "Multiple IP Addresses" in a single instance. And can find the health of the sever continuously for a maximum of 10 hosts. The ping data such as Ipaddress, RoundTripTime, Time To Live (Ttl), Buffer Size and the status are shown in a table. The ManageEngine Free ping tool gives...
Category: Internet / Tools & Utilities
Publisher: ZOHO Corporation, License: Freeware, Price: USD $0.00, File Size: 1.5 MB
Platform: Windows
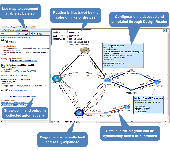
Create network diagrams instantly and use dynamic Diagram to document CCIE/CCNP/CCNA lab with configure snippet and show-command output automatically. By making network knowledge visual, NetBrain PE significantly shortens your learning journey toward Cisco certification. A must-have Software for driven network engineers. Hundreds of powerful features work well with both Cisco...
Category: Internet / News Applications
Publisher: NetBrain Technologies, Inc., License: Freeware, Price: USD $0.00, File Size: 102.0 MB
Platform: Windows
WTides is a free program that uses harmonics data to predict tide heights at many locations throughout the World, and displays a Graph of the results according to the time zone of the target location. The tide Graph can be overlaid with a solunar chart to give an interesting version of the Maori Fishing Calendar. The program runs on any version of Microsoft Windows from Windows 95.
Category: Multimedia & Design / Digital Media Editors
Publisher: Managing Data Resources (NZ) Ltd, License: Freeware, Price: USD $0.00, File Size: 601.9 KB
Platform: Windows