Free Downloads: Line Graph Function
License: All | Free

Archim is a program for drawing the graphs of all kinds of functions. You can define a Graph explicitly and parametrically, in polar and spherical coordinates, on a plane and in space (surface). Archim will be useful for teachers and students, as well as for everyone who is interested min geometry. With Archim, you will draw the Graph of any Function and form, just use your...
Category: Home & Education
Publisher: Stochastic Lab, License: Freeware, Price: USD $0.00, File Size: 479.6 KB
Platform: Windows
Function Analyzer is a program that draws the Graph of a Function with one variable declared by the user. The operators used to build the mathematical expression are the usual ones used in software calculators: * for multiplying, / for dividing, ^ for power and so on. Parentheses can be used to group terms in your expression. Trigonometric functions are also supported,...
Category: Home & Education / Mathematics
Publisher: Lorenzi Davide, License: Freeware, Price: USD $0.00, File Size: 1.3 MB
Platform: Windows
The Library GraphDiag is intended for building Graph and diagrams on HBITMAP, surface DirectDraw and in file BMP format. The Library can build the graphs on entered text Line and diagrams, as from tables, which format is provided by developer, so and from files HTML-format and from XLS files Excel. Given version first and is not deprived defect and restrictions. The Restrictions...
Category: Software Development / Components & Libraries
Publisher: Kruchinin Aleksandr, License: Freeware, Price: USD $0.00, File Size: 67.0 KB
Platform: Windows
Graph Studio is the open source graph drawing/processing software.
Graph Studio is the open source Graph drawing/processing software. It allows users to build and process highly customizable graphs.
Category: Multimedia & Design
Publisher: sourceforge.net, License: Freeware, Price: USD $0.00, File Size: 118.0 KB
Platform: Windows, Mac, Vista
ANDI-Diveplanner is a statistical simulation software.
ANDI-Diveplanner is a statistical simulation software.
The Dive Profile window displays a graphic representation of the current dive plan. It takes the form of an inverted Line Graph. Displayed on the Graph is the depth and time of each profile segment (indicated with a blue Line), with a graphical representation of gas changes (indicated with a scuba...
Category: Software Development / Misc. Programming
Publisher: Andi Systems PTY Ltd., License: Freeware, Price: USD $0.00, File Size: 474.2 KB
Platform: Windows
DeadLine is a free program useful for solving equations, plotting graphs and obtaining an in-depth analysis of a Function. Designed especially for students and engineers, the freeware combines Graph plotting with advanced numerical calculus, in a very intuitive approach. Most equations are supported, including algebraic equations, trigonometric equations, exponential equations,...
Category: Audio
Publisher: Ionut Alex. Chitu, License: Freeware, Price: USD $0.00, File Size: 1.4 MB
Platform: Windows
GraphTablet is a handy application to create blank graph paper.
GraphTablet is a handy application to create blank Graph paper. It doesn’t have any help file, but it is very easy to use and can be helpful for students, pupils and even for preschool age kids as a graphic coloring paper.
GraphTablet offers you a clear interface and has only one window. It consists of the “Preview” window on the right and all controls and...
Category: Multimedia & Design / Multimedia App's
Publisher: Michael Eve, License: Freeware, Price: USD $0.00, File Size: 272.9 KB
Platform: Windows
Graph constructs, visualizes and modifies graphs as well as calculates measures and layouts.
Graph constructs, visualizes and modifies graphs as well as calculates measures and layouts.
CoSBiLab Graph can construct, visualize and modify graphs as well as calculate measures and layouts. CoSBiLab Graph can import and export data in a variety of formats, among which the reaction network generated by the beta WorkBench.
Category: Multimedia & Design / Multimedia App's
Publisher: CoSBi, License: Freeware, Price: USD $0.00, File Size: 3.1 MB
Platform: Windows
MatheGrafix is an excellent tool that allows you to plot 2D graphs including linear, geometric, exponential, fractals ones and more. The program operates in two modes: you can introduce the formula and plot the Graph or you can draw interactively a geometric Function on the Graph.
There are two important windows: the "Mode functions" window which is...
Category: Business & Finance / Applications
Publisher: Roland Hammes, License: Freeware, Price: USD $0.00, File Size: 1.8 MB
Platform: Windows
DataPlot is a program where you can import your time based data and graph it.
DataPlot is a program where you can import your time based data and Graph it.You can move easily back and forward in user defined time window, allows individual time setting for each Graph, values read directly in Graph by dragging mouse over the curve and much more
Category: Multimedia & Design / Multimedia App's
Publisher: CBIM, License: Freeware, Price: USD $0.00, File Size: 311.0 KB
Platform: Windows
Drawing graphs without the right tool is simply difficult.
Drawing graphs without the right tool is simply difficult. uDraw(Graph) automates this task for you. Find out how uDraw(Graph) creates your flow charts, diagrams, hierarchies or structure visualizations using automatic layout - much faster than with any standard drawing program. With the API, uDraw(Graph) can even be embedded in your own programs as a visualization component.
Category: Multimedia & Design / Image Editing
Publisher: University Bremen, FB3, Germany, License: Freeware, Price: USD $0.00, File Size: 2.6 MB
Platform: Windows
GRQ2 Remote Control software includes a BYPASS and ACTIVE matrix to manage the status of every GRQ2 Function. Make fine adjustments to other GRQ2 functions, including graphic EQ filter widths, from ½ octave to one full octave, and adjust attack release, and knee on the compressor. We'll even show you a Line Graph of your gain structure, graphically displaying...
Category: Audio / Utilities & Plug-Ins
Publisher: Sabine Musical Manufacturing Inc., License: Freeware, Price: USD $0.00, File Size: 6.1 MB
Platform: Windows
SBHistogram generates simple histograms from simple ASCII data files.
SBHistogram generates simple histograms from simple ASCII data files. It's a simple tool designed to be easy to use.
A histogram is a chart in which data values in counted and placed into buckets. For example, let's assume you want to do a histogram of peoples ages. Then you might want to use buckets such as 1-10 years, 11-20 years, 21-30 years, etc. Each bucket counts the...
Category: Multimedia & Design / Multimedia App's
Publisher: SB-Software, License: Freeware, Price: USD $0.00, File Size: 604.0 KB
Platform: Windows
The WebViewer plug-in enables Windows users whether or not they have SigmaPlot to explore the data used to create the Graph.
Using the WebViewer plug-in with your Web browser window you can:
- View the data used to create the Graph
- Print a Graph in a web document at full resolution
- Zoom in and out of a Graph
- Grab and...
Category: Multimedia & Design / Graphics Viewers
Publisher: SYSTAT Software Inc., License: Freeware, Price: USD $0.00, File Size: 12.6 MB
Platform: Windows
With The Option Strategy Builder you could pick up an option and place it directly to the return Graph. As with the online tool, just drag and drop the option on the Graph, and build your strategy. Using your mouse, the options can be easily moved on the Graph to different strike prices, and to different expiration dates.
With this program you can manage your...
Category: Multimedia & Design / Multimedia App's
Publisher: SamoaSky, License: Freeware, Price: USD $0.00, File Size: 3.1 MB
Platform: Windows
Graph-A-Ping allows you to visually see the ping latency between ping times.
Graph-A-Ping allows you to visually see the ping latency between ping times. The bigger the gap between one ping to another allows you to spot possible network bottle neck.
This tool is actually an applet part of Glass Net Networks monitoring console.
Category: Internet / Misc. Plugins
Publisher: Mataluis.Com, License: Freeware, Price: USD $0.00, File Size: 2.1 MB
Platform: Windows
Math Mechanixs is an easy to use scientific and engineering FREE math software program. (FREE registration is required after 60 days). The typical tool for solving mathematical problem has been the calculator. Unfortunately, a calculator can be very limiting. They do not allow the user to record detailed notes regarding their work. Until the graphing calculator, the user could not...
Category: Business & Finance
Publisher: Math Mechanixs, LLC., License: Freeware, Price: USD $0.00, File Size: 8.7 MB
Platform: Windows
Graph Extract is a program for digitizing plots.
Graph Extract is a program for digitizing plots. Using either manual or automated approaches, this program provides a means to easily extract numeric data from plots. The resulting X-Y data can be printed or replotted, or it can be saved in Excel file for
Category: Multimedia & Design
Publisher: quadtechassociates.com, License: Freeware, Price: USD $0.00, File Size: 446.0 KB
Platform: Windows
Distribution Guide is a program allowing to build various graphs of statistical distributions.
Distribution Guide is a program allowing to build various graphs of statistical distributions. It enables you to enter the parameters of the particular distribution and display the graphs of such functions as PDF, CDF, and others. Printing support is provided as well.
Supported distributions:
- Exponential
- Lognormal
- Normal
- Weibull
- Uniform
Supported...
Category: Home & Education / Mathematics
Publisher: MathWave Technologies, License: Freeware, Price: USD $0.00, File Size: 1.1 MB
Platform: Windows
Graph visualization is a way of representing structural information as diagrams of abstract graphs and networks. Automatic Graph drawing has many important applications in software engineering, database and web design, networking, and in visual interfaces
Category: Multimedia & Design
Publisher: graphviz.org, License: Freeware, Price: USD $0.00, File Size: 26.6 MB
Platform: Windows, Mac, Vista
The NetGraph – network monitor 2.
The NetGraph – network monitor 2.0 is a software network-monitoring program that enables users to see at a glance the activities on their networks including the volumes of traffic with four simple Graph mode indicators.
The program works on any Windows’ network connection and NetGraph – network monitor 2.0’s four modes include 2 snapshot modes and 2...
Category: Internet / Monitoring
Publisher: Nikola Dachev, License: Freeware, Price: USD $0.00, File Size: 0
Platform: Windows
MathTrax is a graphing tool for middle school and high school students to Graph equations, physics simulations or plot data files.
The graphs have descriptions and sound so you can hear and read about the Graph. Blind and low vision users can access visual math data and Graph or experiment with equations and datasets.
Category: Business & Finance / Applications
Publisher: The MathTrax Team, License: Freeware, Price: USD $0.00, File Size: 21.0 MB
Platform: Windows
RJS Graph produces professional scientific and mathematical graphs.
RJS Graph produces professional scientific and mathematical graphs. You may study the data with a wide range of data analysis tools. Features include the ability to plot data and equations, fit best fit curves and splines, and display fitted best fit curve parameters. Data can be pasted from a spreadsheet or imported from a text file using a wizard.
Category: Home & Education / Mathematics
Publisher: RJS, License: Freeware, Price: USD $0.00, File Size: 3.7 MB
Platform: Windows
T&D Graph has been designed as a user friendly software which brings users even more effective tools for the management and analysis of data recorded by T&D Data Loggers. It contains a variety of useful functions including the ability to read and merge multiple data files and display recorded data in Graph and/or list form.
Category: Software Development / Misc. Programming
Publisher: T&D CORPORATION, License: Freeware, Price: USD $0.00, File Size: 11.3 MB
Platform: Windows
Easing Generator is custom easing function editor for ActionScript tween engine.
Easing Generator is custom easing Function editor for ActionScript tween engine. You can set original easing to tween transition parameter. Interface looks like Flash Professional CS5, but this is AIR App. So, you can get free.
Main features:
- edit Graph path
- click copy button
- paste to your project
Category: Software Development / Misc. Programming
Publisher: Yasunobu Ikeda, License: Freeware, Price: USD $0.00, File Size: 700.2 KB
Platform: Windows
JGraph is the leading Open Source Java Graph Visualization Library.
JGraph is the leading Open Source Java Graph Visualization Library. It follows Swing design patterns to provide an API familiar to Swing programmers and functionality that provides a range of features. Graph visualization is a central requirement for applications such as workflow editors, computer and telecommunication networks display, flowcharts, VLSI and CAD, business process...
Category: Software Development / Components & Libraries
Publisher: JGraph Ltd, License: Freeware, Price: USD $0.00, File Size: 136.0 KB
Platform: Windows, Linux, Mac
ZGrapher is a simple graphic utility.
ZGrapher is a simple graphic utility. It can be helpful for any user, from a schoolboy to a professional mathematician. Using this program you can plot graphs of the following types: Y(x), X(y), R(a) – in polar coordinates, X(t) and Y(t) – parametric equations and graphs of tables. To create a Graph you should specify its parameters – formula, Graph’s...
Category: Home & Education / Mathematics
Publisher: Palam Software, Inc., License: Freeware, Price: USD $0.00, File Size: 619.8 KB
Platform: Windows
Displays graphs of algebraic functions in a variety of forms.
Displays graphs of algebraic functions in a variety of forms. These include polar and cartesian co-ordinates, parametric and intrinsic functions. A wide range of functions are built-in, from simple trig and hyperbolic functions to things such as the ceil and gamma functions. On-screen HTML help is bulit-in.
Functions can be defined such as
f(x)= 1 + x
These can be of unlimited...
Category: Home & Education / Mathematics
Publisher: Walter Milner, License: Freeware, Price: USD $0.00, File Size: 150.0 KB
Platform: Windows

Obtain data from images of graphs scanned from articles or available as image. Import the Graph into ScanIt from a scanner or file, or from the clipboard. Define locations of the Graph's axes by indicating known points. Extract data from the Graph by manually picking points, by scanning for points or by scanning along curves. Copy the scanned data to Excel or export data to...
Category: Home & Education / Science
Publisher: amsterchem, License: Freeware, Price: USD $0.00, File Size: 6.1 MB
Platform: Windows
With Speed Test you can monitor CPU (over 8 cores) and RAM usage by itself and it has the ability to test; - Maximum bandwidth speed (Internet Speed Test)- Your own website download speed, response time and errors- Hard drive space and activity- Ping response times- WIFI Signal strength- Battery Charge status- LAN bandwidth- Upload and download data transfers- Single process memory usage and so...
Category: Desktop Enhancements
Publisher: Absolute Futurity, License: Freeware, Price: USD $0.00, File Size: 870.4 KB
Platform: Windows
GraphData is designed to automatically extract numeric data from charts (bmp, gif, jpg, etc.
GraphData is designed to automatically extract numeric data from charts (bmp, gif, jpg, etc.), facilitating the work of extraction the numbers and increasing its accuracy.
The program finds the Graph's Line through its color, to be specified by the user in advance. Therefore can not appear in the image other graphics or text that have the same color as the...
Category: Software Development / Misc. Programming
Publisher: Ricardo Sgrillo, License: Freeware, Price: USD $0.00, File Size: 2.4 MB
Platform: Windows
FC_RTGraph is a tool that allows you to collect and graph information from SNMP devices.
FC_RTGraph is a tool that allows you to collect and Graph information from SNMP devices. FC_RTGraph takes an XML formatted config file as input. FC_RTGraph is an excellent tool for real-time monitoring. Collected SNMP data can be graphed in highly customizable 3D graphs (Bar, Area, Line, 3D). FC_RTGraph can be run on Microsoft Windows 2000/2003, XP and Vista. FC_RTGraph supports...
Category: Internet / Monitoring
Publisher: Finnleys, License: Freeware, Price: USD $0.00, File Size: 1.7 MB
Platform: Windows
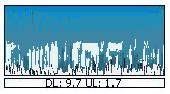
BitMeter 2 is a bandwidth meter, it allows you to visually monitor your internet connection by displaying a scrolling Graph that shows your upload and download speed over time. BitMeter is freeware - ie. it is given away completely free of charge, there is no trial period, no time-limited features, no spyware, and no adware, guaranteed. BitMeter displays a coloured...
Category: Internet
Publisher: Codebox Software, License: Freeware, Price: USD $0.00, File Size: 1017.3 KB
Platform: Windows
BitMeter 2 is a bandwidth meter, it allows you to visually monitor your internet connection by displaying a scrolling Graph that shows your upload and download speed over time. BitMeter is freeware - ie. it is given away completely free of charge, there is no trial period, no time-limited features, no spyware, and no adware, guaranteed. BitMeter displays a coloured Graph showing...
Category: Internet / Monitoring
Publisher: Codebox Software, License: Freeware, Price: USD $0.00, File Size: 1013.8 KB
Platform: Windows
 Freeware
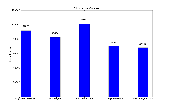
Free Graph Generator is a simple bar chart generation tool that lets you create custom bar charts of any size. Edit bar color, bar width, bar title, and bar side label properties.
Category: Home & Education / Mathematics
Publisher: Innovative Creations Software, License: Freeware, Price: USD $0.00, File Size: 16.5 MB
Platform: Windows
SigmaGraph is a data plotting and analysis software designed to be lightweight, reliable and easy to use. SigmaGraph runs on Windows 2000, XP, Vista and Windows 7, and will be ported to GNU/Linux and Mac OS X.
SigmaGraph offers almost all the functionality needed by scientists and engineers: editable datasheets (column properties, create series, set column values by using any...
Category: Business & Finance / Database Management
Publisher: SIDI.CC, License: Freeware, Price: USD $0.00, File Size: 2.6 MB
Platform: Windows
Biorhytm is a small application that generates your biorhytm status.
Biorhytm is a small application that generates your biorhytm status.
Enter your birthday and a Graph will reveal your
bio health, with charts and lines displaying your physical, intellectual and emotional state as well. You can save result Graph to BMP file.
Category: Home & Education / Astrology & Numerology
Publisher: aOlej, License: Freeware, Price: USD $0.00, File Size: 389.0 KB
Platform: Windows
Plot Digitizer is a great piece of software developed by Joseph A.
Plot Digitizer is a great piece of software developed by Joseph A. Huwaldt. The main goal of the program is to extract information from two-dimensional plots or graphs. It is very common to find information the form of a plot or Graph, showing the relation between two variables. However, this information will not be useful until data is converted to standard x-y values (table format)....
Category: Multimedia & Design / Multimedia App's
Publisher: Joseph A. Huwaldt, License: Freeware, Price: USD $0.00, File Size: 4.4 MB
Platform: Windows
iTraffic Monitor is a network monitor and reporting tool.
iTraffic Monitor is a network monitor and reporting tool. It provides real time Graph of network traffic. Detailed stats provide daily/weekly/monthly/yearly stats.
Main features:
- Monitor and review your Internet or network bandwidth usage with ease.
- How fast your internet connection? We can Graph it for your review.
- How much data do yo u...
Category: Internet / Monitoring
Publisher: Charles DeWeese, License: Freeware, Price: USD $0.00, File Size: 1.1 MB
Platform: Windows
PeCo-Graph is the software for the procurement and graphical visualisation of the counting data from one or multiple PeCo range units. An easy-to-use application for PC that eases the download of the counting data and simplifies their analysis and graphical representation.
It has multiple charts to easily make presentations, for instance, with comparisons of the data acquired in...
Category: Business & Finance / Business Finance
Publisher: Visual Tools S.A., License: Freeware, Price: USD $0.00, File Size: 3.3 MB
Platform: Windows
This free program plots in realtime all data sent and received using the Dial-Up Networking Adapter and Modem. Shows separate sent, received, send rate, received rate, peaks and totals. Five graphs and statistics. Animated System Tray Icon. Allows you to change colours, Graph size, sample seconds, 3D Graph, axis and more. Full automated self-upgrade. Autostart with Win95/98. Now...
Category: Internet / Dial-up & Connectivity
Publisher: Ashok Kumar Parmar, License: Freeware, Price: USD $0.00, File Size: 819.2 KB
Platform: Windows
HMGWIN 3000 software is a convenient and simple package for analyzing and archiving curves and logs which have been recorded using the HMG 3000, or for exporting the data for integration into other PC programs.
Basic settings and real-time measurements can be started and displayed directly on the PC screen as measurement curves progress.
Main Features:
- Transfer and...
Category: Business & Finance / Business Finance
Publisher: HYDAC ELECTRONIC, License: Freeware, Price: USD $0.00, File Size: 901.9 KB
Platform: Windows
LiveGraph is a framework for real-time data visualisation, analysis and logging. Distinctive features: - A real-time plotter that can automatically update graphs of your data while it is still being computed by your application. - Concise and simple point-and-click interface that allows to quickly select and compare data series even in applications that output over 1000 series...
Category: Home & Education / Science
Publisher: LiveGraph open-source project, License: Freeware, Price: USD $0.00, File Size: 889.0 KB
Platform: Windows, Mac, Linux
UltraStats Site Monitor is a simple utility to display the real-time traffic Graph of your website on the screen of your PC - it can be used only together with UltraStats.Net statistics service as additional module. The statistics of your website can be collected by UltraStats.Net, if a special HTML fragment is inserted into webpages you wish to track. UltraStats.Net can collect and...
Category: Web Authoring / Site Management
Publisher: UltraStats, License: Freeware, Price: USD $0.00, File Size: 778.2 KB
Platform: Windows
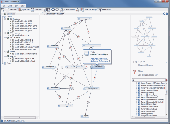
Atlantis Schema Surf is our SQL dependency & live entity ER diagram tool - it is a free animated graphing tool which allows you to easily visualize the dependencies between the objects in your SQL Server databases in a live entity ER diagram.
Schema Surf, like it's counterpart Data Surf, contains a "Surf Graph" which allows you to easily view an object and the...
Category: Business & Finance / Database Management
Publisher: Atlantis Interactive UK Ltd., License: Freeware, Price: USD $0.00, File Size: 7.4 MB
Platform: Windows
WTides is a free program that uses harmonics data to predict tide heights at many locations throughout the World, and displays a Graph of the results according to the time zone of the target location. The tide Graph can be overlaid with a solunar chart to give an interesting version of the Maori Fishing Calendar. The program runs on any version of Microsoft Windows from Windows 95.
Category: Multimedia & Design / Digital Media Editors
Publisher: Managing Data Resources (NZ) Ltd, License: Freeware, Price: USD $0.00, File Size: 601.9 KB
Platform: Windows
GraphSight Junior is an easy to use freeware handy 2D math-graphing program.
GraphSight Junior is an easy to use freeware handy 2D math-graphing program. It was originally designed to help students and teachers satisfy their day-after-day math plotting needs. It makes it easy to plot and explore common Y(X) = F(X) Cartesian graphs, set text labels on the coordinate plane, zoom or shift a Graph with just a single click & move of mouse. The resulting picture...
Category: Home & Education / Miscellaneous
Publisher: CradleFields.com, License: Freeware, Price: USD $0.00, File Size: 393.0 KB
Platform: Windows
JFDraw is a pure Java based graphics application and library package. JFDraw used a little features of Java2D, and expanded a lot of Graph routines for more complex vector Graph processing. You can run JFDraw under any operating systems that suport Java. JFDraw is focused on vector Graph drawing field. It can help you to complete your mechanical, electronic,...
Category: Multimedia & Design
Publisher: JingFei International, License: Freeware, Price: USD $0.00, File Size: 516.6 KB
Platform: Windows, Mac, Linux, Unix, OS/2
Opton is a Windows application designed for use with the Stylitis-10 and Stylitis-Power.
Opton is a Windows application designed for use with the Stylitis-10 and Stylitis-Power. dataloggers. Opton replaces Set-10, adding new features such as better management of datalogger sites and easy sensor factor calculation.
Features:
- Single-click selection of most operations.
- Graphical setup of datalogger.
- Data organized in Windows folders with...
Category: Utilities / Misc. Utilities
Publisher: Symmetron, License: Freeware, Price: USD $0.00, File Size: 7.6 MB
Platform: Windows
XYGraph is a native . NET charting component showing data in a cartesian graph (X,Y).
Controls from componentXtra gives royalty free software integration. Both the free and purchased products includes sample code (VB and C#). .
Category: Software Development
Publisher: componentXtra, License: Freeware, Price: USD $0.00, File Size: 390.6 KB
Platform: Windows