Free Downloads: Multiple Line Graph Chart
License: All | Free
SBHistogram generates simple histograms from simple ASCII data files.
SBHistogram generates simple histograms from simple ASCII data files. It's a simple tool designed to be easy to use.
A histogram is a Chart in which data values in counted and placed into buckets. For example, let's assume you want to do a histogram of peoples ages. Then you might want to use buckets such as 1-10 years, 11-20 years, 21-30 years, etc. Each bucket counts...
Category: Multimedia & Design / Multimedia App's
Publisher: SB-Software, License: Freeware, Price: USD $0.00, File Size: 604.0 KB
Platform: Windows
 Freeware
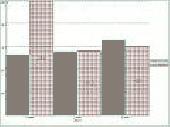
Free Graph Generator is a simple bar chart generation tool that lets you create custom bar charts of any size. Edit bar color, bar width, bar title, and bar side label properties.
Category: Home & Education / Mathematics
Publisher: Innovative Creations Software, License: Freeware, Price: USD $0.00, File Size: 16.5 MB
Platform: Windows
PeCo-Graph is the software for the procurement and graphical visualisation of the counting data from one or Multiple PeCo range units. An easy-to-use application for PC that eases the download of the counting data and simplifies their analysis and graphical representation.
It has Multiple charts to easily make presentations, for instance, with comparisons of the data...
Category: Business & Finance / Business Finance
Publisher: Visual Tools S.A., License: Freeware, Price: USD $0.00, File Size: 3.3 MB
Platform: Windows
NetCharts Designer puts thousands of data visualization design options right at your fingertips for comprehensive Chart, Graph, table, dashboard and scorecard design. Automatic data refresh allows for retrieval from Multiple data sources simultaneously for real-time updates. Plus Designer connects to virtually any data source, supports Multiple development languages...
Category: Multimedia & Design / Fonts
Publisher: Visual Mining, Inc., License: Freeware, Price: USD $0.00, File Size: 28.9 MB
Platform: Windows
Colasoft Ping Tool is a powerful graphic ping tool, it supports ping Multiple IP addresses at the same time, and compares response time in a graphic Chart. You can view historical charts and save the charts to a *.bmp file. With this build-in tool, users can ping the IP addresses of captured packets in Colasoft Capsa (if applicable) conveniently, including resource IP, destination...
Category: Internet
Publisher: Colasoft Co., Ltd., License: Freeware, Price: USD $0.00, File Size: 4.7 MB
Platform: Windows
GraphData is designed to automatically extract numeric data from charts (bmp, gif, jpg, etc.
GraphData is designed to automatically extract numeric data from charts (bmp, gif, jpg, etc.), facilitating the work of extraction the numbers and increasing its accuracy.
The program finds the Graph's Line through its color, to be specified by the user in advance. Therefore can not appear in the image other graphics or text that have the same color as the...
Category: Software Development / Misc. Programming
Publisher: Ricardo Sgrillo, License: Freeware, Price: USD $0.00, File Size: 2.4 MB
Platform: Windows
Financial icon set includes such icons as Coins, Bar Chart, Line Chart, Banknote, Credit Cards, Shopping Cart, Safe, Pie Chart, Invoice, Colden Bullion, Cash Register, Calculater.
Category: Desktop Enhancements / Icon Tools
Publisher: visualpharm.com, License: Freeware, Price: USD $0.00, File Size: 1.5 MB
Platform: Linux, Windows
These FREE sample powerpoint templates are a small representation of the downloadable backgrounds from the awesome powerpoint backgrounds website. Compatible with Microsoft PowerPoint 97, 2000, XP and 2003. Each template comes complete with a complimentary color scheme, ready made Title, Bullet List, Bar Chart, Line Graph, Pie Chart and Diagram. Easy to use, Download...
Category: Business & Finance
Publisher: By Default, License: Freeware, Price: USD $0.00, File Size: 804.2 KB
Platform: Windows, Mac
Graph Studio is the open source graph drawing/processing software.
Graph Studio is the open source Graph drawing/processing software. It allows users to build and process highly customizable graphs.
Category: Multimedia & Design
Publisher: sourceforge.net, License: Freeware, Price: USD $0.00, File Size: 118.0 KB
Platform: Windows, Mac, Vista
ANDI-Diveplanner is a statistical simulation software.
ANDI-Diveplanner is a statistical simulation software.
The Dive Profile window displays a graphic representation of the current dive plan. It takes the form of an inverted Line Graph. Displayed on the Graph is the depth and time of each profile segment (indicated with a blue Line), with a graphical representation of gas changes (indicated with a scuba...
Category: Software Development / Misc. Programming
Publisher: Andi Systems PTY Ltd., License: Freeware, Price: USD $0.00, File Size: 474.2 KB
Platform: Windows
FusionCharts Free is a flash charting component that can be used to render data-driven & animated charts for your web applications and presentations. It is a cross-browser and cross-platform solution that can be used with ASP.NET, ASP, PHP, JSP, ColdFusion, Ruby on Rails, simple HTML pages or even PowerPoint Presentations to deliver interactive and powerful flash charts. You do NOT need to...
Category: Software Development
Publisher: InfoSoft Global (P) Ltd., License: Freeware, Price: USD $0.00, File Size: 2.7 MB
Platform: Windows, Mac, Linux,
GraphTablet is a handy application to create blank graph paper.
GraphTablet is a handy application to create blank Graph paper. It doesn’t have any help file, but it is very easy to use and can be helpful for students, pupils and even for preschool age kids as a graphic coloring paper.
GraphTablet offers you a clear interface and has only one window. It consists of the “Preview” window on the right and all controls and...
Category: Multimedia & Design / Multimedia App's
Publisher: Michael Eve, License: Freeware, Price: USD $0.00, File Size: 272.9 KB
Platform: Windows
KG-Chart for Cross Stitch" is a program to design a chart for cross stitching.
KG-Chart for Cross Stitch" is a program to design a Chart for cross stitching. This program has following features:
* Drawing pixels with mark to distinguish color.
* Color palette (mimic DMC's thread color).
* Drawing backstitching
* Print/Preview/Real view of a Chart.
* Import/Export a Chart to/from other image...
Category: Multimedia & Design / Multimedia App's
Publisher: Keiji Ikuta Software Laboratory, License: Freeware, Price: USD $0.00, File Size: 1.1 MB
Platform: Windows
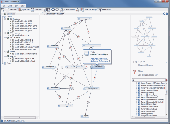
Graph constructs, visualizes and modifies graphs as well as calculates measures and layouts.
Graph constructs, visualizes and modifies graphs as well as calculates measures and layouts.
CoSBiLab Graph can construct, visualize and modify graphs as well as calculate measures and layouts. CoSBiLab Graph can import and export data in a variety of formats, among which the reaction network generated by the beta WorkBench.
Category: Multimedia & Design / Multimedia App's
Publisher: CoSBi, License: Freeware, Price: USD $0.00, File Size: 3.1 MB
Platform: Windows
WTides is a free program that uses harmonics data to predict tide heights at many locations throughout the World, and displays a Graph of the results according to the time zone of the target location. The tide Graph can be overlaid with a solunar Chart to give an interesting version of the Maori Fishing Calendar. The program runs on any version of Microsoft Windows from...
Category: Multimedia & Design / Digital Media Editors
Publisher: Managing Data Resources (NZ) Ltd, License: Freeware, Price: USD $0.00, File Size: 601.9 KB
Platform: Windows
This program will enable you to display data in the colored 3D chart.
This program will enable you to display data in the colored 3D Chart. The program uses the 3D graphics library to display data in the 3D Chart.
Main Features
- Easy import of data from the TXT file.
- Fast 3D graphics.
- Colored scale.
- All properties of the Chart can be edited.
- Increasing data density using a filter...
Category: Multimedia & Design / Image Editing
Publisher: Michal Pohanka, License: Freeware, Price: USD $0.00, File Size: 1.4 MB
Platform: Windows
DataPlot is a program where you can import your time based data and graph it.
DataPlot is a program where you can import your time based data and Graph it.You can move easily back and forward in user defined time window, allows individual time setting for each Graph, values read directly in Graph by dragging mouse over the curve and much more
Category: Multimedia & Design / Multimedia App's
Publisher: CBIM, License: Freeware, Price: USD $0.00, File Size: 311.0 KB
Platform: Windows
Drawing graphs without the right tool is simply difficult.
Drawing graphs without the right tool is simply difficult. uDraw(Graph) automates this task for you. Find out how uDraw(Graph) creates your flow charts, diagrams, hierarchies or structure visualizations using automatic layout - much faster than with any standard drawing program. With the API, uDraw(Graph) can even be embedded in your own programs as a visualization component.
Category: Multimedia & Design / Image Editing
Publisher: University Bremen, FB3, Germany, License: Freeware, Price: USD $0.00, File Size: 2.6 MB
Platform: Windows
MB Free Astrology Natal Chart Software is a free astrology natal Chart generator software based on the principles of western astrology or tropical astrology. This program tells us in detail the accurate astronomical locations of planets at the time of an individual's birth. Using the information that your birth Chart gives, Western Astrology can forecast all important...
Category: Home & Education / Science
Publisher: MysticBoard.com, License: Freeware, Price: USD $0.00, File Size: 1.7 MB
Platform: Windows
XYGraph is a native . NET charting component showing data in a cartesian graph (X,Y).
Controls from componentXtra gives royalty free software integration. Both the free and purchased products includes sample code (VB and C#). .
Category: Software Development
Publisher: componentXtra, License: Freeware, Price: USD $0.00, File Size: 390.6 KB
Platform: Windows
T&D Graph has been designed as a user friendly software which brings users even more effective tools for the management and analysis of data recorded by T&D Data Loggers. It contains a variety of useful functions including the ability to read and merge Multiple data files and display recorded data in Graph and/or list form.
Category: Software Development / Misc. Programming
Publisher: T&D CORPORATION, License: Freeware, Price: USD $0.00, File Size: 11.3 MB
Platform: Windows
MB Free Astrology Birth Chart Software is a free astrology birth Chart generator software based on the principles of western astrology and Vedic astrology. This program tells us in detail the accurate astronomical locations of planets at the time of an individual's birth. Using the information that your birth Chart gives, Western and Vedic Astrology can forecast all...
Category: Home & Education / Miscellaneous
Publisher: MysticBoard.com, License: Freeware, Price: USD $0.00, File Size: 1.7 MB
Platform: Windows
A very commonly requested Excel feature is the ability to add labels to XY chart data points.
A very commonly requested Excel feature is the ability to add labels to XY Chart data points. The XY Chart Labeler adds this feature to Excel. The XY Chart Labeler provides the following options:
- Add XY Chart Labels - Adds labels to the points on your XY Chart data series based on any range of cells in the workbook.
- Move XY Chart...
Category: Business & Finance / MS Office Addons
Publisher: Application Professionals, License: Freeware, Price: USD $0.00, File Size: 1.2 MB
Platform: Windows
The WebViewer plug-in enables Windows users whether or not they have SigmaPlot to explore the data used to create the Graph.
Using the WebViewer plug-in with your Web browser window you can:
- View the data used to create the Graph
- Print a Graph in a web document at full resolution
- Zoom in and out of a Graph
- Grab and...
Category: Multimedia & Design / Graphics Viewers
Publisher: SYSTAT Software Inc., License: Freeware, Price: USD $0.00, File Size: 12.6 MB
Platform: Windows
LiveGraph is a framework for real-time data visualisation, analysis and logging. Distinctive features: - A real-time plotter that can automatically update graphs of your data while it is still being computed by your application. - Concise and simple point-and-click interface that allows to quickly select and compare data series even in applications that output over 1000 series...
Category: Home & Education / Science
Publisher: LiveGraph open-source project, License: Freeware, Price: USD $0.00, File Size: 889.0 KB
Platform: Windows, Mac, Linux
MB Free Astrology Birth Chart Software is a free astrology birth Chart generator software based on the principles of western astrology and Vedic astrology. This program tells us in detail the accurate astronomical locations of planets at the time of an individual's birth. Using the information that your birth Chart gives, Western and Vedic Astrology can forecast all...
Category: Home & Education / Miscellaneous
Publisher: MysticBoard.com, License: Freeware, Price: USD $0.00, File Size: 1.7 MB
Platform: Windows
With The Option Strategy Builder you could pick up an option and place it directly to the return Graph. As with the online tool, just drag and drop the option on the Graph, and build your strategy. Using your mouse, the options can be easily moved on the Graph to different strike prices, and to different expiration dates.
With this program you can manage your...
Category: Multimedia & Design / Multimedia App's
Publisher: SamoaSky, License: Freeware, Price: USD $0.00, File Size: 3.1 MB
Platform: Windows
Software FX is offering a free charting solution for Windows Forms created with Visual Studio.
Software FX is offering a free charting solution for Windows Forms created with Visual Studio.Net or C# Builder. With Chart FX Lite for .NET you will be able to integrate basic charting capabilities into your Windows Forms applications. Whether you code in C# or VB.NET, you will find Chart FX Lite for .NET is an extremely versatile charting control that can be deployed.
...
Category: Web Authoring / Web Design Utilities
Publisher: Software FX Inc., License: Freeware, Price: USD $0.00, File Size: 2.3 MB
Platform: Windows

Archim is a program for drawing the graphs of all kinds of functions. You can define a Graph explicitly and parametrically, in polar and spherical coordinates, on a plane and in space (surface). Archim will be useful for teachers and students, as well as for everyone who is interested min geometry. With Archim, you will draw the Graph of any function and form, just use your...
Category: Home & Education
Publisher: Stochastic Lab, License: Freeware, Price: USD $0.00, File Size: 479.6 KB
Platform: Windows
Graph-A-Ping allows you to visually see the ping latency between ping times.
Graph-A-Ping allows you to visually see the ping latency between ping times. The bigger the gap between one ping to another allows you to spot possible network bottle neck.
This tool is actually an applet part of Glass Net Networks monitoring console.
Category: Internet / Misc. Plugins
Publisher: Mataluis.Com, License: Freeware, Price: USD $0.00, File Size: 2.1 MB
Platform: Windows
Freeware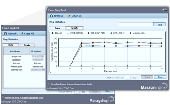
The ManageEngine FREE Ping tool is a simple yet powerful tool with an elegant UI that helps to issue ping requests to "Multiple IP Addresses" in a single instance. And can find the health of the sever continuously for a maximum of 10 hosts. The ping data such as Ipaddress, RoundTripTime, Time To Live (Ttl), Buffer Size and the status are shown in a table. The ManageEngine Free ping tool...
Category: Internet / Tools & Utilities
Publisher: ZOHO Corporation, License: Freeware, Price: USD $0.00, File Size: 1.5 MB
Platform: Windows
The Library GraphDiag is intended for building Graph and diagrams on HBITMAP, surface DirectDraw and in file BMP format. The Library can build the graphs on entered text Line and diagrams, as from tables, which format is provided by developer, so and from files HTML-format and from XLS files Excel. Given version first and is not deprived defect and restrictions. The Restrictions...
Category: Software Development / Components & Libraries
Publisher: Kruchinin Aleksandr, License: Freeware, Price: USD $0.00, File Size: 67.0 KB
Platform: Windows
Digiquartz Assistant is an application specifically created to collect and Graph the data acquired from any of the Digiquartz intelligent products. These products are used for pressure measurement purposes. In other words, the devices measure real physical conditions (e.g. pressure, pressure period, internal temperature, external temperature, and humidity) and convert these samples into...
Category: Internet / Communications
Publisher: Paroscientific, Inc., License: Freeware, Price: USD $0.00, File Size: 6.1 MB
Platform: Windows
MB Free Vedic Astrology Rashi Chart (North Indian Style) Software is a rashi Chart software based on Vedic Astrology. This program tells us in detail the accurate astronomical locations of planets at the time ofan individual's birth. Using the information that your birth Chart gives, Vedic Astrology can forecast all important incidents and probable opportunities that can...
Category: Home & Education / Science
Publisher: MysticBoard.com, License: Freeware, Price: USD $0.00, File Size: 1.5 MB
Platform: Windows
MB Free Vedic Astrology Rashi Chart (East Indian Style) Software is a rashi Chart software based on Vedic Astrology. This program tells us in detail the accurate astronomical locations of planets at the time of an individual's birth. Using the information that your birth Chart gives, Vedic Astrology can forecast all important incidents and probable opportunities that can...
Category: Home & Education / Miscellaneous
Publisher: MysticBoard.com, License: Freeware, Price: USD $0.00, File Size: 1.5 MB
Platform: Windows
MB Free Vedic Astrology Rashi Chart (South Indian Style) Software is a rashi Chart software based on Vedic Astrology. This program tells us in detail the accurate astronomical locations of planets at the time of an individual's birth. Using the information that your birth Chart gives, Vedic Astrology can forecast all important incidents and probable opportunities that can...
Category: Home & Education / Science
Publisher: MysticBoard.com, License: Freeware, Price: USD $0.00, File Size: 1.5 MB
Platform: Windows
Atlantis Schema Surf is our SQL dependency & live entity ER diagram tool - it is a free animated graphing tool which allows you to easily visualize the dependencies between the objects in your SQL Server databases in a live entity ER diagram.
Schema Surf, like it's counterpart Data Surf, contains a "Surf Graph" which allows you to easily view an object and the...
Category: Business & Finance / Database Management
Publisher: Atlantis Interactive UK Ltd., License: Freeware, Price: USD $0.00, File Size: 7.4 MB
Platform: Windows

Obtain data from images of graphs scanned from articles or available as image. Import the Graph into ScanIt from a scanner or file, or from the clipboard. Define locations of the Graph's axes by indicating known points. Extract data from the Graph by manually picking points, by scanning for points or by scanning along curves. Copy the scanned data to Excel or export data to...
Category: Home & Education / Science
Publisher: amsterchem, License: Freeware, Price: USD $0.00, File Size: 6.1 MB
Platform: Windows
With Chart FX Lite for .NET, Visual Studio®.NET Windows Forms developers can employ (for free) many of the powerful features available from the most respected technology in the component industry.
Software FX is offering a free charting solution for Windows Forms created with Visual Studio.Net or C# Builder. With Chart FX Lite for .NET you will be able to...
Category: Software Development / Misc. Programming
Publisher: Software FX, License: Freeware, Price: USD $0.00, File Size: 2.3 MB
Platform: Windows
Graph Extract is a program for digitizing plots.
Graph Extract is a program for digitizing plots. Using either manual or automated approaches, this program provides a means to easily extract numeric data from plots. The resulting X-Y data can be printed or replotted, or it can be saved in Excel file for
Category: Multimedia & Design
Publisher: quadtechassociates.com, License: Freeware, Price: USD $0.00, File Size: 446.0 KB
Platform: Windows
Graph visualization is a way of representing structural information as diagrams of abstract graphs and networks. Automatic Graph drawing has many important applications in software engineering, database and web design, networking, and in visual interfaces
Category: Multimedia & Design
Publisher: graphviz.org, License: Freeware, Price: USD $0.00, File Size: 26.6 MB
Platform: Windows, Mac, Vista
The Chart Catalogue is designed for the preparation of orders for the purchase of TX–97 format charts from Transas Marine.
The catalogue window consists of three parts:
- Information panel containing the Chart catalogues;
- Chart panel with the outlines of selected charts overlaid on the map of the world;
- Utility's main menu.
Category: Home & Education / Miscellaneous
Publisher: Transas Marine (UK) Ltd., License: Freeware, Price: USD $0.00, File Size: 7.9 MB
Platform: Windows
JFreeChart is a free Java class library for generating charts (GNU LGPL). Support is included for: pie charts, bar charts, Line charts, scatter plots, time series charts, candlestick charts, high-low-open-close charts and more. Use in applications, servlets, JSP or applets. Export to PNG, JPEG, PDF, SVG and HTML image maps. Complete source code is included, subject to the GNU LGPL.
Category: Software Development
Publisher: Object Refinery Limited, License: Freeware, Price: USD $0.00, File Size: 5.3 MB
Platform: Windows, Linux, Unix
The NetGraph – network monitor 2.
The NetGraph – network monitor 2.0 is a software network-monitoring program that enables users to see at a glance the activities on their networks including the volumes of traffic with four simple Graph mode indicators.
The program works on any Windows’ network connection and NetGraph – network monitor 2.0’s four modes include 2 snapshot modes and 2...
Category: Internet / Monitoring
Publisher: Nikola Dachev, License: Freeware, Price: USD $0.00, File Size: 0
Platform: Windows
MathTrax is a graphing tool for middle school and high school students to Graph equations, physics simulations or plot data files.
The graphs have descriptions and sound so you can hear and read about the Graph. Blind and low vision users can access visual math data and Graph or experiment with equations and datasets.
Category: Business & Finance / Applications
Publisher: The MathTrax Team, License: Freeware, Price: USD $0.00, File Size: 21.0 MB
Platform: Windows
We have invested 3 years into developing our Excel Gantt Chart templates incorporating the requirements of hundreds of customers. Whilst our solutions look simple and are easy to use, they are the most powerful, professional Gantt Chart templates available.
After years in senior Project Management roles, the founder of Chart Gantt, Marcus Tarrant, found that most...
Category: Business & Finance / Project Management
Publisher: Chartgantt.com, License: Freeware, Price: USD $0.00, File Size: 466.0 KB
Platform: Windows, Mac
Genealogica Grafica is the successor of KStableau.
Genealogica Grafica is the successor of KStableau. The program offers broad charting capabilities, such as: ancestor Chart (pedigree) plus outline, descendants Chart plus outline, ancestor tree,descendant tree, timeline descendants Chart, inbreeding charts, relationship charts, circle diagrams, geographic map of birthplaces.
This program has an a clear user interface...
Category: Home & Education / Genealogy
Publisher: Tom de Neef, License: Freeware, Price: USD $0.00, File Size: 2.1 MB
Platform: Windows
DatPlot is a free data visualization application that was developed to easily and quickly create strip Chart plots from delimited text files, such as CSV or similar files. Data can be plotted using Line or scatter plots, events can be marked and parameter values at the event lines are automatically labeled. Finally, by swapping source data files, Multiple plots of similar...
Category: Utilities / Misc. Utilities
Publisher: Aeroperf, License: Freeware, Price: USD $0.00, File Size: 1.2 MB
Platform: Windows
RJS Graph produces professional scientific and mathematical graphs.
RJS Graph produces professional scientific and mathematical graphs. You may study the data with a wide range of data analysis tools. Features include the ability to plot data and equations, fit best fit curves and splines, and display fitted best fit curve parameters. Data can be pasted from a spreadsheet or imported from a text file using a wizard.
Category: Home & Education / Mathematics
Publisher: RJS, License: Freeware, Price: USD $0.00, File Size: 3.7 MB
Platform: Windows
GROW (Gestation Related Optimal Weight) is the software used to generate a customised antenatal growth Chart.
The Chart is based on the calculation of an individual, optimal weight standard for the duration of the pregnancy to reflect the baby’s growth potential. By adjusting for maternal variables (maternal height, weight in early pregnancy, parity and ethnic group),...
Category: Software Development / Tools & Editors
Publisher: Gestation Network, License: Freeware, Price: USD $0.00, File Size: 419.4 KB
Platform: Windows