Free Downloads: Statistical Graphs
License: All | Free
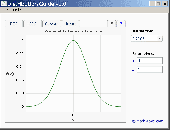
Distribution Guide is a program allowing to build various graphs of statistical distributions.
Distribution Guide is a program allowing to build various Graphs of Statistical distributions. It enables you to enter the parameters of the particular distribution and display the Graphs of such functions as PDF, CDF, and others. Printing support is provided as well.
Supported distributions:
- Exponential
- Lognormal
- Normal
- Weibull
-...
Category: Home & Education / Mathematics
Publisher: MathWave Technologies, License: Freeware, Price: USD $0.00, File Size: 1.1 MB
Platform: Windows
InfoStat is general-purpose software for statistical analysis.
InfoStat is general-purpose software for Statistical analysis. It covers all the basic needs for descriptive Statistical analysis and the production of Graphs for the exploratory analysis.
It also has advanced Statistical methods for Statistical modeling and multivariate analysis. One of its strengths is its simple interface combined with...
Category: Business & Finance / Business Finance
Publisher: Grupo InfoStat, License: Freeware, Price: USD $0.00, File Size: 33.9 MB
Platform: Windows
AUGURIUM is a software system, which is intended for a broad spectrum of data analysis problems, namely Statistical analysis, prediction and classification. It allows you to input or import data about your problem area, store them in a database, manage them, analyze and visualize.AUGURIUM automates data capture, data mining and data analysis in business, economics, medicine, biology,...
Category: Business & Finance / Applications
Publisher: Augurium Software, License: Freeware, Price: USD $0.00, File Size: 2.4 MB
Platform: Windows
Simfit is a computer package for simulation, Statistical analysis, curve fitting and graph plotting using models from a compiled library or from ASCII text files supplied by the user. It can be used for teaching the principles of curve fitting, simulation and Statistical analysis to students, but it will be found most useful by those interested in serious data analysis and...
Category: Business & Finance / Applications
Publisher: University of Manchester, License: Freeware, Price: USD $0.00, File Size: 13.6 MB
Platform: Windows
InVivoStat is a powerful, free to use, Statistical software package which uses R as its statistics engine. It is designed specifically for scientists conducting animal experiments. The package combines complex and powerful Statistical tools (within R) with a user interface that is both easy to use and intuitive to the non-statistician.
While no package can comment on...
Category: Business & Finance / Applications
Publisher: InVivoStat, License: Freeware, Price: USD $0.00, File Size: 25.8 MB
Platform: Windows
RLPlot is is a plotting program to create high quality graphs from data.
RLPlot is is a plotting program to create high quality Graphs from data. Based on values stored in a spreadsheet several menus help you to create Graphs of your choice. The Graphs are displayed as you get them (Wysiwyg). Double click any element of the gr
Category: Multimedia & Design
Publisher: rlplot.sourceforge.net, License: Freeware, Price: USD $0.00, File Size: 1024.0 KB
Platform: Windows, Mac, 2K, 2K3
Microsoft Mathematics Add-in for Word and OneNote makes it easy to plot Graphs in 2D and 3D, calculate numerical results, solve equations or inequalities, and simplify algebraic expressions in your Word documents and OneNote notebooks.
The Microsoft Mathematics Add-in can help you with the following tasks:
Compute standard mathematical functions, such as roots and...
Category: Home & Education / Mathematics
Publisher: Microsoft, License: Freeware, Price: USD $0.00, File Size: 6.6 MB
Platform: Windows
This software adds a ribbon to excel with a number of statistical buttons.
This software adds a ribbon to excel with a number of Statistical buttons.This is not intended to be a full Statistical analysis package, but only a source for quick visualizations and calculations. Is very easy to install and to use with any type of Microsoft Excel.
Category: Utilities / Misc. Utilities
Publisher: Roger Pharr, License: Freeware, Price: USD $0.00, File Size: 6.0 MB
Platform: Windows
STATPerl (Statistics with Perl) is a free Statistical Software based on Perl.
STATPerl (Statistics with Perl) is a free Statistical Software based on Perl. Perl source codes for various Statistical analysis are given with it. User can add new analysis and edit existing one. An inbuilt Perl IDE comes with it. It is a simple to use program.
Category: Business & Finance / Database Management
Publisher: Ratul Chakraborty, License: Freeware, Price: USD $0.00, File Size: 3.1 MB
Platform: Windows
Decrypto offers both dictionary and statistical attacks.
Decrypto offers both dictionary and Statistical attacks. In a dictionary attack, it tries to match up words in the dictionary against words in the puzzle. This means it can solve any puzzle that consists of words found in the dictionary, but it also employs techniques to deal with the occasional non-dictionary word. The Statistical attack is effective on a broad range of puzzles,...
Category: Software Development / Misc. Programming
Publisher: Edwin Olson, License: Freeware, Price: USD $0.00, File Size: 2.8 MB
Platform: Windows
GeoSurveillance is software that combines spatial Statistical routines with some basic Geographic Information Systems (GIS) functions to carry out retrospective and prospective Statistical tests for the detection of geographic clustering. In this software, the focus is primarily on the spatial Statistical analysis. Consequently, full GIS functionality is not provided. GIS...
Category: Home & Education / Miscellaneous
Publisher: NCGIA, License: Freeware, Price: USD $0.00, File Size: 2.4 MB
Platform: Windows
Wykresy is a simple, user-friendly program drawing functions, Graphs as well as circles and ellipses. More than 20 function templates provide fast creation of functions. Derivatives and combinations of functions can be easily added. Up to 10 Graphs can be seen simultaniously, each of them in color set by user. It is very easy to make an approach and see more details, or browse...
Category: Home & Education / Mathematics
Publisher: Piotr Kubowicz, License: Freeware, Price: USD $0.00, File Size: 675.8 KB
Platform: Windows
Eigenmath is a small application that can make graphs to mathematical functions.
Eigenmath is a small application that can make Graphs to mathematical functions. It is simple to use, and has a user manual that explains all the functions, so even the novice user will be able to make Graphs very quickly. It can calculate derivatives, gradients, template functions, integrals as well as make Graphs to arc length, line integrals, surface area, surface...
Category: Home & Education / Mathematics
Publisher: George Weigt, License: Freeware, Price: USD $0.00, File Size: 569.0 KB
Platform: Windows
The PC-Axis family consists of a number of programs for the Windows and Internet environment used to present Statistical information.
PC-Axis is a new and useful software for your computers. It is mostly used by the Statistical offices in different countries to let their users retrieve statistics.
Category: Utilities / Misc. Utilities
Publisher: scb, License: Freeware, Price: USD $0.00, File Size: 4.9 MB
Platform: Windows
Software for Determining Balanced Graphs is a free software.
Software for Determining Balanced Graphs is a free software.
A computational method for determining wheether a given graph with weights on the vertices, is balanced so that it can be associated as an invariant, folds maps of closed surface in the plane, the sphere and the projective plane.
Category: Business & Finance / Applications
Publisher: Jeferson Coelho, P. David Romero and C. Mendes Jesus, License: Freeware, Price: USD $0.00, File Size: 1012 B
Platform: Windows
The NetGraph – network monitor 2.
The NetGraph – network monitor 2.0 is a software network-monitoring program that enables users to see at a glance the activities on their networks including the volumes of traffic with four simple graph mode indicators.
The program works on any Windows’ network connection and NetGraph – network monitor 2.0’s four modes include 2 snapshot modes and 2 graph...
Category: Internet / Monitoring
Publisher: Nikola Dachev, License: Freeware, Price: USD $0.00, File Size: 0
Platform: Windows
Free Daily Thoroughbred Handicapping Graphs available for all tracks running.
Free Daily Thoroughbred Handicapping Graphs available for all tracks running.. Designed using a 2 million-line database. A7 is simplest, fastest software ever created. A single click prints the Graphs an entire card. No charge. Nothing to buy. FREE expert analysis available everyday. Even children can pick winners using this FREE software. From the 15 year leader in thoroughbred...
Category: Utilities / System Utilities
Publisher: RaceCom, Inc, License: Freeware, Price: USD $0.00, File Size: 1.9 MB
Platform: Windows
Survo Editor is a great program that can be used for the analysis of Statistical data both in teaching and research applications.
Survo Editor covers about a half of SURVO MM functions(editorial and touch mode computing), set of operations for general data management (FILE CREATE, FILE SHOW, FILE MAKE, etc) and collection of Statistical operations with various features.
Category: Software Development / Misc. Programming
Publisher: Survo Systems, License: Freeware, Price: USD $0.00, File Size: 6.8 MB
Platform: Windows
R is a language and environment for statistical computing and graphics.
R is a language and environment for Statistical computing and graphics. It is a GNU project which is similar to the S language and environment which was developed at Bell Laboratories (formerly AT&T, now Lucent Technologies) by John Chambers and colleagues. R can be considered as a different implementation of S. There are some important differences, but much code written for S runs...
Category: Utilities / Misc. Utilities
Publisher: R Development Core Team, License: Freeware, Price: USD $0.00, File Size: 19.9 MB
Platform: Windows
Graph constructs, visualizes and modifies graphs as well as calculates measures and layouts.
Graph constructs, visualizes and modifies Graphs as well as calculates measures and layouts.
CoSBiLab Graph can construct, visualize and modify Graphs as well as calculate measures and layouts. CoSBiLab Graph can import and export data in a variety of formats, among which the reaction network generated by the beta WorkBench.
Category: Multimedia & Design / Multimedia App's
Publisher: CoSBi, License: Freeware, Price: USD $0.00, File Size: 3.1 MB
Platform: Windows
If you are searching for a computer program that can plot simple Graphs on your PC, GraphSight Junior is what you are looking for. This utility is feature rich and comprehensive. It plots 2D Graphs with easy navigation, and it’s well suited for high school and college math students.
It can plot Cartesian, polar, table defined, as well as specialty Graphs, such...
Category: Home & Education / Mathematics
Publisher: CradleFields.com, License: Freeware, Price: USD $0.00, File Size: 417.5 KB
Platform: Windows
Designed to help students learn and apply practical analytical skills, but also ideal for those who need a low-cost alternative for producing basic summary statistics at school or work. Conduct Statistical analyses and prepare descriptive summary reports. Create and analyze crosstabulations, descriptive statistics, and basic significance tests. Create data files with AcaStat or import...
Category: Home & Education
Publisher: AcaStat Software, License: Freeware, Price: USD $0.00, File Size: 8.0 MB
Platform: Windows
MicrOsiris is a comprehensive statistical and data management package for Windows.
MicrOsiris is a comprehensive Statistical and data management package for Windows. Includes special techniques for data mining and analysis of nominal and ordinal-scaled data, and an interface to IVEware, the Michigan Survey Research Center's imputation software.
Category: Business & Finance / Database Management
Publisher: Van Eck Computer Consulting, License: Freeware, Price: USD $0.00, File Size: 6.8 MB
Platform: Windows
This application renders a number of moving fragments of sine and cosine Graphs, meant to be visually attractive. For Windows XP. The application is designed for use on a modern LCD.
Category: Home & Education / Miscellaneous
Publisher: english.rejbrand.se, License: Freeware, Price: USD $0.00, File Size: 517.0 KB
Platform: Windows
Data Pilot is specially created to expand data analysis options available in Microsoft Excel with nonparametric Statistical methods. The Statistical methods used in the application provides the most relevant results even with small numbers of samples (3 or more observations), without any assumptions on distribution of the original sample. This is especially important when...
Category: Home & Education
Publisher: Two Pilots, License: Freeware, Price: USD $0.00, File Size: 792.9 KB
Platform: Windows
This provides a set of tools and library for constructing maximum entropy model.
This provides a set of tools and library for constructing maximum entropy model.Maxent Entropy Model is a general purpose machine learning framework that has proved to be highly expressive and powerful in Statistical natural language processing, Statistical physics, computer vision and many other fields.
Category: Software Development / Misc. Programming
Publisher: Le Zhang, License: Freeware, Price: USD $0.00, File Size: 1.2 MB
Platform: Windows
ArrayNorm is an platform-independent Java tool for normalization and Statistical analysis for microarray-experiment data. It provides modules for visualization (scatterplot, histogram, boxplot, etc.), normalization and analysis. The user can upload any number of microarray-datasets, resulting from one experiment. According to experimental design and relationships between the microarrays,...
Category: Business & Finance / Applications
Publisher: Institute of Genomics and Bioinformatics, TU Graz, License: Freeware, Price: USD $0.00, File Size: 61.6 MB
Platform: Windows
Holmes is an automated debugging and failure-analysis tool that uses Statistical analysis of code-coverage data to identify the most likely cause of test failures. Holmes uses a custom data-collection tool to amass detailed path coverage during testing. The tool analyzes this coverage data to find paths that strongly correlate with failure. Holmes integrates seamlessly with all test...
Category: Software Development / Debugging
Publisher: Microsoft, License: Freeware, Price: USD $0.00, File Size: 6.5 MB
Platform: Windows
Statcato is a free Java software application developed for elementary statistical computations.
Statcato is a free Java software application developed for elementary Statistical computations. Its features are tailored for community college statistics students and instructors.
Category: Home & Education / Mathematics
Publisher: statcato.org, License: Freeware, Price: USD $0.00, File Size: 11.2 MB
Platform: Windows, Mac, Vista, 2008
The HBU is an Hymedis client application that allows you to present the Hymedis information on Graphs and as normal data. Different Hymedis parameters can be presented as Graphs or as updated data.
In different tabs a user can select parameter combinations and, when a connection is established, every minute the latest data is picked up from the central server in Vlissingen....
Category: Multimedia & Design / Multimedia App's
Publisher: HBU, License: Freeware, Price: USD $0.00, File Size: 51.6 MB
Platform: Windows
MatheGrafix is an excellent tool that allows you to plot 2D Graphs including linear, geometric, exponential, fractals ones and more. The program operates in two modes: you can introduce the formula and plot the graph or you can draw interactively a geometric function on the graph.
There are two important windows: the "Mode functions" window which is the main one,...
Category: Business & Finance / Applications
Publisher: Roland Hammes, License: Freeware, Price: USD $0.00, File Size: 1.8 MB
Platform: Windows
AUTOMATIC IMAGE REGISTRATION AND MOSAICKING SYSTEM.
AUTOMATIC IMAGE REGISTRATION AND MOSAICKING SYSTEM.
The registration system is a full featured application intended for beginners and advanced users. Registration may be achieved by one simple click or may be controlled by several parameters. A Statistical procedure is used to characterize good and bad registrations. Based on this “good fit-bad fit” Statistical...
Category: Multimedia & Design / Multimedia App's
Publisher: Regeemy Development Group, License: Freeware, Price: USD $0.00, File Size: 2.8 MB
Platform: Windows
HEC-EFM analyses involve: 1) Statistical analyses of relationships between hydrology and ecology, 2) hydraulic modeling, and 3) use of Geographic Information Systems (GIS) to display results and other relevant spatial data.
Most features in the main interface of HEC-EFM focus on the first step in this process (Statistical analyses). The main interface has four tabs:...
Category: Home & Education / Miscellaneous
Publisher: Hydrologic Engineering Center, License: Freeware, Price: USD $0.00, File Size: 9.0 MB
Platform: Windows


 Freeware
NADetector monitors and analyzes the network traffic and displays Statistical information pertaining to each IP address pair and protocol, helping network administrators and users troubleshoot network problems. The main purpose of NADetector is to allow you to collect Statistical information about your network traffic that passes through network adapters and display incoming,...
Category: Internet / Monitoring
Publisher: Nsasoft US LLC, License: Freeware, Price: USD $0.00, File Size: 702.1 KB
Platform: Windows
ZGrapher is a simple graphic utility.
ZGrapher is a simple graphic utility. It can be helpful for any user, from a schoolboy to a professional mathematician. Using this program you can plot Graphs of the following types: Y(x), X(y), R(a) – in polar coordinates, X(t) and Y(t) – parametric equations and Graphs of tables. To create a graph you should specify its parameters – formula, graph’s...
Category: Home & Education / Mathematics
Publisher: Palam Software, Inc., License: Freeware, Price: USD $0.00, File Size: 619.8 KB
Platform: Windows
SIENA is a program for the statistical analysis of network data, with the focus on social networks.
SIENA is a program for the Statistical analysis of network data, with the focus on social networks.
Networks here are understood as entire (complete) networks, not as personal (egocentered) networks: it is assumed that a set of nodes (social actors) is given, and all ties (links) between these nodes are known - except perhaps for a moderate amount of missing data.
Category: Web Authoring / Web Design Utilities
Publisher: John M. Light, License: Freeware, Price: USD $0.00, File Size: 2.4 MB
Platform: Windows
This series lets users experiment with, build, study the math of, and play a game based on 3D scene Graphs--the hierarchy of transformations used to draw objects in a 3D scene.
This first applet shows how changing the transformations of a scene graph affects the final result and how each transformation affects the space in which child nodes are transformed.
...
Category: Games / Misc. Games
Publisher: Brown University, License: Freeware, Price: USD $0.00, File Size: 1.3 KB
Platform: Windows
R is a free software environment for statistical computing and graphics.
R is a free software environment for Statistical computing and graphics. It compiles and runs on a wide variety of UNIX platforms, Windows and MacOS.
The background technology is available as a set of components for all platforms to easily build custom applications based on the powerful data analysis and graphics toolboxes from R and Scilab. We support a wide range of...
Category: Business & Finance / MS Office Addons
Publisher: Erich Neuwirth, License: Freeware, Price: USD $0.00, File Size: 3.9 MB
Platform: Windows
Graph visualization is a way of representing structural information as diagrams of abstract Graphs and networks. Automatic graph drawing has many important applications in software engineering, database and web design, networking, and in visual interfaces
Category: Multimedia & Design
Publisher: graphviz.org, License: Freeware, Price: USD $0.00, File Size: 26.6 MB
Platform: Windows, Mac, Vista
TagsReport reads any HTML file and displays Statistical information about the tags that appear in it. You can use this utility to locate problems in your HTML page.
For Example: If the end counter value for tag is different from the start counter value, something is possibly wrong in your HTML file, because every tag must have a closing tag.
Category: Web Authoring / Web Design Utilities
Publisher: NirSoft, License: Freeware, Price: USD $0.00, File Size: 27.4 KB
Platform: Windows
Drawing graphs without the right tool is simply difficult.
Drawing Graphs without the right tool is simply difficult. uDraw(Graph) automates this task for you. Find out how uDraw(Graph) creates your flow charts, diagrams, hierarchies or structure visualizations using automatic layout - much faster than with any standard drawing program. With the API, uDraw(Graph) can even be embedded in your own programs as a visualization component.
Category: Multimedia & Design / Image Editing
Publisher: University Bremen, FB3, Germany, License: Freeware, Price: USD $0.00, File Size: 2.6 MB
Platform: Windows
HYGINIST is a tailor-made, industrial hygiene statistical tool.
HYGINIST is a tailor-made, industrial hygiene Statistical tool. It evaluates the exposure data collected with the standard exposure assessment strategies. It draws probability plots of three to two thousand data and tests the goodness-of-fit with the Lognormal distribution. In contrast to other programs HYGINIST helps you to develop a cost-effective sampling plan, uses unbiased estimates...
Category: Software Development / Help File Utilities
Publisher: Scheffers TSAC, License: Freeware, Price: USD $0.00, File Size: 7.8 MB
Platform: Windows
This is an data logging software.
This is an data logging software. It is used for system configuration (naming sensors, setting alarm thresholds), downloading of data to a computer (for long term storage), graphical analysis of data (using inbuilt features or exporting data to other software applications), publishing data to a website (Graphs and raw data), and computer print-outs (print Graphs, raw data, summary...
Category: Internet / Misc. Plugins
Publisher: Pico Technology, License: Freeware, Price: USD $0.00, File Size: 10.0 MB
Platform: Windows
Murata Chip S-Parameter & Impedance Library enables you to calculate, view and print Graphs of the impedance and S parameter data for chip capacitors or chip inductors. S parameter data in Touchstone format can also be copied.
Main features:
- Easy operation due to using Windows interface.
- Fast calculation of data and Graphs for the S...
Category: Business & Finance / Applications
Publisher: Murata Manufacturing. Co., Ltd., License: Freeware, Price: USD $0.00, File Size: 3.3 MB
Platform: Windows
EpiCalc 2000 is a statistical calculator that works with pre-tabulated data.
EpiCalc 2000 is a Statistical calculator that works with pre-tabulated data. Some of the functions available in EpiCalc will be of general use but they have been chosen to be of interest to persons working with data from a public health or epidemiological context. EpiCalc is a 32-bit Microsoft Windows application and will run under Microsoft Windows '95, '98, and NT 3.51 or...
Category: Business & Finance / Calculators
Publisher: Brixton Books, License: Freeware, Price: USD $0.00, File Size: 1.6 MB
Platform: Windows
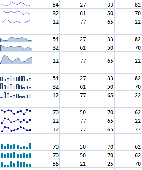
TinyGraphs is an open source Excel add-in that creates sparklines, mini column Graphs, and area Graphs from a row of data. It generates beautiful tiny graphics that are as small as a cell and can be placed next to the items that they describe. The tiny graphics, or sparklines, are as tall as the text around them and are useful for visualizing large quantities of data, such as...
Category: Business & Finance / Spreadsheets
Publisher: ConnectCode Pte Ltd, License: Freeware, Price: USD $0.00, File Size: 344.0 KB
Platform: Windows
AlgoSim is a numerical calculator with features such as function plotting, one variable Statistical analysis, and visual creation of user-defined algorithms. The program has calculus features, represented by numerical differentiation, integration and loca
Category: Home & Education / Miscellaneous
Publisher: english.rejbrand.se, License: Freeware, Price: USD $0.00, File Size: 780.0 KB
Platform: Windows, Mac, 2K, 2K3
A completely free professional charting tool with candlesticks,advanced statistical tools,easy to use interface and multiple currency pairs
Category: Business & Finance / Project Management
Publisher: SaxoBank, License: Freeware, Price: USD $0.00, File Size: 216.0 KB
Platform: Windows
SciViews-R is a series of packages providing a GUI API on top of R, a free (Open Source) Statistical software based on the S language.
SciViews is one of the first GUI for R and it is developed since 2001. It mainly targets students, beginners and occasional users that would like to master R, but are afraid of its command line interface. With time, SciViews also becomes a...
Category: Multimedia & Design / Multimedia App's
Publisher: Philippe Grosjean, License: Freeware, Price: USD $0.00, File Size: 9.5 MB
Platform: Windows
Cumulative Probability Plot does all of the Statistical mathematics for you and outputs the data in a visual format that can be easily interpreted by people with a limited knowledge of statistics.
The graph is also useful for a quick demonstration to regulators or other interested parties that your product or process is within acceptable tolerance or meets regulatory limits.
Category: Multimedia & Design / Multimedia App's
Publisher: Rad Pro Calculator, License: Freeware, Price: USD $0.00, File Size: 8.8 MB
Platform: Windows


