Free Downloads: Candlestick Charts
JFreeChart is a free Java class library for generating Charts (GNU LGPL). Support is included for: pie Charts, bar Charts, line Charts, scatter plots, time series Charts, Candlestick Charts, high-low-open-close Charts and more. Use in applications, servlets, JSP or applets. Export to PNG, JPEG, PDF, SVG and HTML image maps. Complete...
Category: Software Development
Publisher: Object Refinery Limited, License: Freeware, Price: USD $0.00, File Size: 5.3 MB
Platform: Windows, Linux, Unix
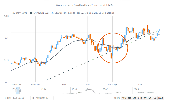
FCharts SE is a free stock charting program which will import price data from a wide range of sources, displaying it as OHLC, Candlestick and Line Charts. It has a number of built-in indicators (MACD, RSI, Exponential and Standard Moving Averages), or you can write your own with the inbuilt formula language and display them as standalone Charts or overlays. You can draw...
Category: Business & Finance / Business Finance
Publisher: Spacejock Software, License: Freeware, Price: USD $0.00, File Size: 3.1 MB
Platform: Windows
FCharts SE is a free stock charting program which will import price data from a wide range of sources, displaying it as OHLC, Candlestick and Line Charts. It has a number of built-in indicators (MACD, RSI, Exponential and Standard Moving Averages), or you can write your own with the inbuilt formula language and display them as standalone Charts or overlays. You can draw...
Category: Business & Finance / Business Finance
Publisher: Spacejock Software, License: Freeware, Price: USD $0.00, File Size: 3.1 MB
Platform: Windows, Vista
The SSChart Candlestick charting software runs under Windows and Charts financial data from a variety of sources. Realtime intraday charting of futures, stocks, options, indicies and forex with data from Interactive Brokers TWS. Graphical trading from the Charts in either simulated or real mode. Realistic paper trading using real-time data.
Features:
-...
Category: Business & Finance / Business Finance
Publisher: Simian Savants LLC, License: Shareware, Price: USD $50.00, File Size: 4.3 MB
Platform: Windows
Set of Php Classes for creating charts and graphs.
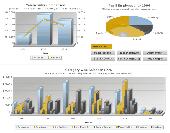
Set of Php Classes for creating Charts and graphs. It supports more than 18 types (linechart, piechart, barchart, radarchart, curves , gauges, 3D Charts, Candlestick, areacharts) and combinations of them. It includes a richt set of features like labels, notes, tips, multiple axis, logarithmic axis, date axis, pattern fillings, transparencies, stacked axis, stacked...
Category: Web Authoring / Web Design Utilities
Publisher: J4L Components, License: Demo, Price: USD $40.00, File Size: 1.0 MB
Platform: Windows, Linux

CandleScanner is a technical analysis software package created for investors interested in Japanese candle patterns. What makes this application exceptional is that, from the outset, it has been specifically designed for the detection of Japanese candle patterns. It is not just an add-on to an existing analysis platform, but a specialist charting application written by people with an extensive...
Category: Business & Finance / Business Finance
Publisher: Lempart, License: Demo, Price: USD $10.00, File Size: 27.8 MB
Platform: Windows
CandleScanner is a technical analysis software package created for investors interested in Japanese candle patterns. What makes this application exceptional is that, from the outset, it has been specifically designed for the detection of Japanese candle patterns. It is not just an add-on to an existing analysis platform, but a specialist charting application written by people with an extensive...
Category: Business & Finance / Business Finance
Publisher: Lempart, License: Demo, Price: USD $349.00, File Size: 34.9 MB
Platform: Windows
Aspose.Chart is a .Net charting component. With it, you can: ceeate more than 20 basic Charts types including Area, Bar, Bubble, Contour, Candlestick, Cube, Curve, CurveArea, Doughnut, Gantt, HighLowClose, Line, OpenHighLowClose, Pareto, Pie, Pyramid, Point, Radar, Scatter, Step, Surface, etc; Create Charts with effects including 3D, frame border, anti-alias, transparency,...
Category: Software Development / Components & Libraries
Publisher: Aspose Pty Ltd, License: Shareware, Price: USD $249.00, File Size: 1.1 MB
Platform: Windows
FCharts SE is a free stock charting program which will import price data from a wide range of sources, displaying it as OHLC, Candlestick and Line Charts. It has a number of built-in indicators (MACD, RSI, Exponential and Standard Moving Averages), or you can write your own with the inbuilt formula language and display them as standalone Charts or overlays. You can draw...
Category: Business & Finance
Publisher: Spacejock Software, License: Freeware, Price: USD $0.00, File Size: 3.1 MB
Platform: Windows
Anychart is a flexible Macromedia Flash-based solution that allows you to create animated, compact, interactive and attractive Charts. Major Features: * Driven by XML interface - Anychart offers you a variety of options, such as setting transparency, color, URL linking, captions and more. And you can do all these customizations via an XML File, no Flash source modifications...
Category: Software Development
Publisher: AnyChart.Com, License: Shareware, Price: USD $49.00, File Size: 2.9 MB
Platform: Windows, Mac, Linux, Palm,
The charting technique and analysis has become very popular among investors.
The charting technique and analysis has become very popular among investors. Charts have been employed worldwidely as the primary tool and often reflect short or long term trends. Also, the charting technique shows us the critical points to determine buy or sell timing, support or resistance price levels, and signal strength. In order to improve your investing efficiency, chart analysis...
Category: Business & Finance / Applications
Publisher: Japan Science & Technology Inc, License: Demo, Price: USD $95.00, File Size: 1.5 MB
Platform: Windows
AnyChart Stock and Financial JS Charts (short: AnyStock) is a JavaScript based financial and stock charting library, also used for visualizing any timeline data over a long time. AnyStock technology turns your real-time data into highly sophisticated Charts with interactive features, bringing visualization of your data to the Web and providing a full feature set for creating...
Category: Web Authoring / JavaScript
Publisher: AnyChart JavaScript Charts, License: Shareware, Price: USD $49.00, File Size: 17.7 MB
Platform: Windows, Mac, Linux,
VisionLITE software helps you to keep track of your stocks.
VisionLITE software helps you to keep track of your stocks.
Main Features:
- Projection of signals directly on the stockcharts
- Quick access to all Charts with fullscreen display
- Website with Tips on how to use VisionLITE
- Download the latest updates for FREE
- Keep track of every trade with this monitor window
- Intradaycharts...
Category: Business & Finance / Business Finance
Publisher: PAVELL Software, License: Shareware, Price: USD $132.70, File Size: 4.5 MB
Platform: Windows
FusionCharts Free is a flash charting component that can be used to render data-driven & animated Charts for your web applications and presentations. It is a cross-browser and cross-platform solution that can be used with ASP.NET, ASP, PHP, JSP, ColdFusion, Ruby on Rails, simple HTML pages or even PowerPoint Presentations to deliver interactive and powerful flash Charts. You...
Category: Software Development / Components & Libraries
Publisher: InfoSoft Global (P) Ltd., License: Freeware, Price: USD $0.00, File Size: 2.7 MB
Platform: Windows, Mac, Linux,
FusionCharts Free is a flash charting component that can be used to render data-driven & animated Charts for your web applications and presentations. It is a cross-browser and cross-platform solution that can be used with ASP.NET, ASP, PHP, JSP, ColdFusion, Ruby on Rails, simple HTML pages or even PowerPoint Presentations to deliver interactive and powerful flash Charts. You...
Category: Software Development
Publisher: InfoSoft Global (P) Ltd., License: Freeware, Price: USD $0.00, File Size: 2.7 MB
Platform: Windows, Mac, Linux,
TBO Advanced Chart Pattern Recognition (ACPR) is a powerful Price Line, Candlestick and Point & Figure Pattern Recognition system.
If you can imagine the pattern or trend then TBO ACPR allows you to draw it, scan for it, and find any matching Charts in just seconds.
It works with both end-of-day and real-time data and can alert you to new patterns...
Category: Business & Finance / Business Finance
Publisher: TimBukOne, License: Shareware, Price: USD $99.00, File Size: 10.2 MB
Platform: Windows
Parity Plus is one of the most powerful Stock Charting and Technical Analysis Programs available on the market. Parity includes over 50 of the most popular indicators for the technical analysis of stocks and commodities. The majority of these indicators act as functions that return an array, which can be used as the input to another indicator or within a user defined formula. This makes it easy...
Category: Business & Finance / Project Management
Publisher: DITEC International, License: Shareware, Price: USD $122.00, File Size: 634.9 KB
Platform: Windows
Medved QuoteTracker is a Windows program that provides streaming real-time quotes, live intraday Charts with technical indicators, level II, Time & Sales, alerts, news monitoring, research, and dynamic historical Charts. It also features Candlestick, OHLC, TICK, VOLUME, RANGE, Renko, Point & Figure, and Heikin-Ashi-style intraday Charts, multiple bottom...
Category: Business & Finance / Project Management
Publisher: QuoteTracker, LP, License: Freeware, Price: USD $0.00, File Size: 7.7 MB
Platform: Windows
Point & Figure Charts, a stock analysis tool, accepts free market data source from opentick.
Point & Figure Charts, a stock analysis tool, accepts free market data source from opentick.com and any flat files in text, ASCII format that you can get from the Internet free such as Yahoo Finance, MSN Finance etc.
Point & Figure Chart is the premier feature:
Point & Figure Charts, an interactive software can generate powerful Charts to help user...
Category: Business & Finance / Applications
Publisher: Numeral Technology LLC, License: Commercial, Price: USD $30.00, File Size: 1.2 MB
Platform: Windows
 Commercial
The Financial Charting Component is a specifically designed, high end stock charting component. Its great features include: 1. Written in 100 percent Visual C Sharp (CLS Compliant) 2. Integrated with Microsoft Visual Studio 2003 and 2005 3. Friendly usability and interactivity 4. Point and Figure exposed as API 5. FCC runs faster. 6. Striking visual effects 7. Property...
Category: Business & Finance / Applications
Publisher: Numeral Technology LLC, License: Commercial, Price: USD $349.99, File Size: 4.2 MB
Platform: Windows
All charts are displayed in one window.
All Charts are displayed in one window. User may compare different Charts of one stock or Charts of different stocks easily.
- Advanced indicators: EquiVolume, Point & Figure, GMMA, Heiken-Ashi, Volatility Stop Loss.
Point & Figure Charts consist of columns of X's and O's that represent filtered price movements over time. It is...
Category: Multimedia & Design / Multimedia App's
Publisher: Stock-Anal, License: Shareware, Price: USD $0.00, File Size: 0
Platform: Windows
Tool to easily follow the stock market using Point and Figure charts.
Tool to easily follow the stock market using Point and Figure Charts. Get a set of updated Charts everyday in your mailbox (or if you prefer download the Charts files from our website) We have Charts of the following markets: US US mutual funds, ETF's and iShares Canada United Kingdom Europe Australia Select stocks in minutes with our 'Buy the Winner' view! Comes...
Category: Business & Finance / Applications
Publisher: Magic Potion, License: Demo, Price: USD $49.00, File Size: 7.6 MB
Platform: Windows,
Shareware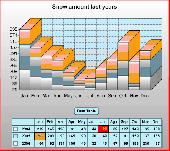
Super 2d/3d Graph Library is a customizable and powerful, yet light, .NET libray for drawing eye-candy Charts and/or export them into PDF format, vector (Scalable Vector Graphics or SVG) and raster graphics file formats such as JPG, GIF, PNG, BMP, ... Same component may be used in WinForms or ASP.NET applications. Powerful features such as high resolution render, additional calculations,...
Category: Software Development / Components & Libraries
Publisher: Software Siglo XXI, License: Shareware, Price: USD $129.00, EUR99, File Size: 1.2 MB
Platform: Windows
Freeware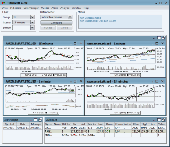
Stock charting and technical analysis software with a user-friendly interface targeted for stock investors and realtime traders. Supported dataproviders are Yahoo and Interactive Brokers. With the easy to use script language, you can create your own backtests, indicators, screener, real-time alerts and drawing tools! While you are backtesting, TickInvest creates a history of your previous...
Category: Business & Finance / Applications
Publisher: Erich Behmen, License: Freeware, Price: USD $0.00, File Size: 25.9 MB
Platform: Windows
Freeware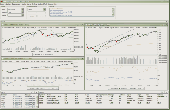
Stock charting and technical analysis software with a user-friendly interface targeted for stock investors and realtime traders. Supported dataproviders are Yahoo and Interactive Brokers.With the easy to use script language, you can create your own backtests, indicators, screener, real-time alerts and drawing tools! While you are backtesting, TickInvest creates a history of your previous...
Category: Business & Finance / Business Finance
Publisher: Erich Behmen, License: Freeware, Price: USD $0.00, File Size: 27.4 MB
Platform: Windows