Free Downloads: Web Charting

iPhoneChart.com Charting for iPad. Charting for iPad is a robust iPad Charting SDK library to create & draw charts in iPad applications. This Charting component provides most common charts for business data visulization. Charting for iPad
Category: Software Development / Components & Libraries
Publisher: iPhoneChart, License: Commercial, Price: USD $499.00, File Size: 195.0 KB
Platform: Windows

iPhoneChart.com Charting for iPhone. Charting for iPhone is a robust iPhone Charting SDK library to create & draw charts in iPhone applications. This Charting component provides most common charts for business data visulization. Charting for iPhone
Category: Software Development / Components & Libraries
Publisher: iPhoneChart, License: Commercial, Price: USD $499.00, File Size: 195.0 KB
Platform: Windows
TeeChart ActiveX includes 60+ Chart types in 2D, 3D to visualize data. From the common Line, Bar, Area, Pie chart to the field-specific charts like Candle OHLC, Point and Figure, Volume, High-Low,BoxPlot,etc It provides a large selection Financial and Statistical Indicators that perform calculations ranging from basic mean; Mode Function, Median Function to the more complex statistical and...
Category: Software Development / Components & Libraries
Publisher: Steema Software, License: Shareware, Price: USD $469.00, File Size: 52.3 MB
Platform: Windows
3D Graphs & Charts is a series of Charting components which can be used bothin intranet and internet Web pages. The comprehensive documentation clearlydemonstrates how to implement each component. With the examples (which include documented html code) you will quicklybe able to incorporate these powerful components into your own pages.
Category: Internet / Tools & Utilities
Publisher: Sirius Computer Consultants Limited, License: Demo, Price: USD $30.00, File Size: 130.0 KB
Platform: Windows
QWXL offers is a charting tool for Microsoft Excel®.
QWXL offers is a Charting tool for Microsoft Excel®. Groundbreaking Charting and statistical options help you visualize the data in your spreadsheet - all at the simple click of a mouse. Unprecedented adaptability lets you customize how QWXL handles limits and calculations, and you can easily print out the charts, save them as graphics or import them into other...
Category: Business & Finance / MS Office Addons
Publisher: Busitech, License: Shareware, Price: USD $299.00, File Size: 11.5 MB
Platform: Windows
This all-in-one package Charting software comes with a fully functional FREE 7-day trial and allows you to perform playback, simulated trading as well as live Charting.
Download a copy today!
When you are satisfied with the package, you can always subscribe to a license here
Category: Business & Finance / Business Finance
Publisher: VXCharts, License: Shareware, Price: USD $47.00, File Size: 670.5 KB
Platform: Windows
 Shareware
CharTTool is an advanced stock Charting software that instantly allows you to display several technical charts of stocks, mutual funds or indices. Intraday and end-of-day stock Charting is available. The list of technical indicators includes Bollinger bands, price channels, moving averages, fast and slow stochastic oscillators, relative strength index, MACD, trading volume and...
Category: Business & Finance / Business Finance
Publisher: Ashkon Technology LLC, License: Shareware, Price: USD $39.95, File Size: 1.1 MB
Platform: Windows, Other
MindFusion.Charting.WebForms provides applications targeting the .NET platform the ability to create and display various kinds of charts. The component supports bar, pie, doughnut, scatter, bubble, line, area, radar and polar charts. Many features of MindFusion.Charting.WebForms output can be customized in a way that suits your project best. Charts can have different styles,...
Category: Software Development / Misc. Programming
Publisher: MindFusion, License: Demo, Price: USD $0.00, File Size: 5.0 MB
Platform: Windows
IT Locus Charting is an advanced Charting application for graphical analysis of financial and stock market.
It supports any number of windows with an arbitrary number of charts of stocks, futures, mutual funds or indices in each of them.
The list of technical indicators includes moving averages, relative strength index, MACD and others.
The charts may be saved and...
Category: Business & Finance / Business Finance
Publisher: ITLocus.com, License: Commercial, Price: USD $9.99, File Size: 9.8 MB
Platform: Windows, Linux, Mac
SharewareBased on the latest versions of Nevron's Charting Engine for ASP.NET and the new Nevron Pivot Data Aggregation Engine, Nevron Chart for SharePoint is optimized for SharePoint (WSS and MOSS), providing advanced Charting functionality and a wide range of features to developers and IT professionals. Nevron Chart for SharePoint features a complete set of 2D and 3D Charting...
Category: Software Development / Components & Libraries
Publisher: Nevron Software LLC, License: Shareware, Price: USD $1239.00, File Size: 121.9 MB
Platform: Windows
Tennis board is made for easy real-time charting with umpiring add-on's.
Tennis board is made for easy real-time Charting with umpiring add-on's. * Umpires: Palm board replaces your piece of paper and your stopwatch. * Coaches, parents: From aces tracking to strokes analysis, chart one or both players and change the Charting mode at any time. * Full statistics : 1st serve%, 2nd serve%, aces, double faults, winners, unforced errors, break points...
Category: Home & Education / Miscellaneous
Publisher: Softeo.net, License: Shareware, Price: USD $47.00, File Size: 162.0 KB
Platform:
This program is an easy-to-use Charting application that can help in monitoring and analysing markets. TradingLevels™ Charting Program can use free Yahoo based unmanaged data or, subscription-based, end-of-day data service depending on what suits your needs.
Yet another great addition to TradingLounge™Analysis member benefits!
Category: Business & Finance / Business Finance
Publisher: TradingLounge, License: Shareware, Price: USD $19.95, File Size: 1.5 MB
Platform: Windows
Freeware
Behind every successful trader or investor is a Charting software. We are lowering your operating cost as a trader and investor by offering you ChartNexus Charting Software for FREE! It comes complete with a comprehensive list of popular indicators and even better, we are offering 3 years of market data for free too! On top of that, you have free access to all the EOD...
Category: Business & Finance / Applications
Publisher: ChartNexus, License: Freeware, Price: USD $0.00, File Size: 3.4 MB
Platform: Windows
Shareware
FusionCharts for Flex is a Charting component for Adobe Flex solutions. It helps you create interactive charts and graphs in your Flex projects. The charts are powered by FusionCharts v3 framework - the industry leader in Adobe Flash Charting. FusionCharts for Flex offers over 45 chart types spanning both 2D and 3D charts, including: * Standard charts like Column, Bar,...
Category: Software Development / Components & Libraries
Publisher: InfoSoft Global (P) Ltd., License: Shareware, Price: USD $299.00, ALL1499, File Size: 14.5 MB
Platform: Windows, Mac, Linux, Unix
PortfolioTK is a stock portfolio manager that provides both accurate quantitative statistics and advanced Charting. It includes overall portfolio equity curve performance with risk analysis, trade log entry supporting partial position matching of both long and short trades, and a Charting database with over 35+ technical indicators. Not only that but you can use PortfolioTK's...
Category: Business & Finance / Project Management
Publisher: Piatek Software, License: Commercial, Price: USD $37.00, File Size: 5.6 MB
Platform: Windows
EspressChart offers Java and Web developers an easy to use, yet powerful toolkit for adding dynamic charts, and Charting capability to Web pages, applets, applications, servlets, and JSPs. With a pure Java architecture, EspressChart can deliver charts on virtually any platform.
Category: Software Development / Misc. Programming
Publisher: Quadbase Systems, Inc., License: Demo, Price: USD $0.00, File Size: 9.2 MB
Platform: Windows
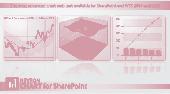
Based on the latest version of Nevron?
Based on the latest version of Nevron?s Charting Engine for ASP.NET and the new Nevron Pivot Data Aggregation Engine, Nevron Chart for SharePoint is optimized for SharePoint (WSS and MOSS), providing advanced Charting functionality and a wide range of features to developers and IT professionals.
Nevron Chart for SharePoint features a complete set of 2D and 3D...
Category: Web Authoring / Web Design Utilities
Publisher: Nevron Software, License: Shareware, Price: USD $1239.00, File Size: 16.3 MB
Platform: Windows
Belfield Software is pleased to be able to offer an excellent Charting package, including a complete portfolio of Admiralty charts for the whole of the UK and Ireland, plus the Charting software . This really does make chart plotting affordable! See also some of Belfield Software's navigation packages
Admiralty chart portfolios are updated annually, tide data up...
Category: Business & Finance / Business Finance
Publisher: Belfield Software, License: Shareware, Price: USD $117.45, File Size: 1.1 GB
Platform: Windows
BursaStation is a state-of-the-art Stock Market Tracker / Share Market Tracker cum Charting Software (Charting Tool) that places in your hands the power to make better investment decisions.
Brought to you as a collaborative effort by ShareInvestor and Bursa Malaysia, BursaStation is designed with you, the user, in mind, as a user-friendly yet full of powerful features...
Category: Business & Finance / Business Finance
Publisher: SI Portal.com Sdn. Bhd., License: Freeware, Price: USD $0.00, File Size: 4.7 MB
Platform: Windows
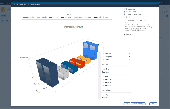
Interactive OLAP Charts for SharePoint 2010 provides SharePoint Web parts for Charting and visual analysis of your OLAP cube data. Easy to set up, and integrate in your existing SharePoint sites. Visualize OLAP data with analysis functionalities which supports visual drilling, slicing, isolating and drillthroughs. With available caching options, provides tool for OLAP data...
Category: Business & Finance / Applications
Publisher: Kyubit, License: Shareware, Price: USD $195.00, File Size: 173.0 KB
Platform: Windows
WebCharts3D is an innovative development toolkit that offers flexibility for all aspects of rich-client and Web-based Charting requirements and provides a complete, single-source solution for data visualization. Many of the world's most successful companies rely on our products to lower the cost of developing and deploying mission critical applications while enhancing the...
Category: Software Development / Misc. Programming
Publisher: GreenPoint Software, Inc., License: Shareware, Price: USD $550.00, File Size: 49.9 MB
Platform: Windows
Software FX is offering a free charting solution for Windows Forms created with Visual Studio.
Software FX is offering a free Charting solution for Windows Forms created with Visual Studio.Net or C# Builder. With Chart FX Lite for .NET you will be able to integrate basic Charting capabilities into your Windows Forms applications. Whether you code in C# or VB.NET, you will find Chart FX Lite for .NET is an extremely versatile Charting control that can be deployed.
Category: Web Authoring / Web Design Utilities
Publisher: Software FX Inc., License: Freeware, Price: USD $0.00, File Size: 2.3 MB
Platform: Windows
FCharts SE is a free stock Charting program which will import price data from a wide range of sources, displaying it as OHLC, Candlestick and Line charts. It has a number of built-in indicators (MACD, RSI, Exponential and Standard Moving Averages), or you can write your own with the inbuilt formula language and display them as standalone charts or overlays. You can draw trend lines with...
Category: Business & Finance
Publisher: Spacejock Software, License: Freeware, Price: USD $0.00, File Size: 3.1 MB
Platform: Windows
Metatrader 4, now available on Ava FX!
Metatrader 4, now available on Ava FX! One of the world's most advanced trading platforms; its powerful technical analysis, Charting, and modeling tools make it the ideal platform for the more sophisticated traders who use these tools. Superior Charting and trading from charts. capabilities.
Category: Audio / Utilities & Plug-Ins
Publisher: Ava FX, License: Demo, Price: USD $0.00, File Size: 5.3 MB
Platform: Windows
Commercial
The Financial Charting Component is a specifically designed, high end stock Charting component. Its great features include: 1. Written in 100 percent Visual C Sharp (CLS Compliant) 2. Integrated with Microsoft Visual Studio 2003 and 2005 3. Friendly usability and interactivity 4. Point and Figure exposed as API 5. FCC runs faster. 6. Striking visual effects...
Category: Business & Finance / Applications
Publisher: Numeral Technology LLC, License: Commercial, Price: USD $349.99, File Size: 4.2 MB
Platform: Windows