Free Downloads: Visualization Graph
License: All | Free
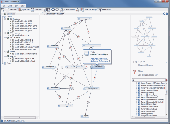
Graph Visualization is a way of representing structural information as diagrams of abstract graphs and networks. Automatic Graph drawing has many important applications in software engineering, database and web design, networking, and in visual interfaces
Category: Multimedia & Design
Publisher: graphviz.org, License: Freeware, Price: USD $0.00, File Size: 26.6 MB
Platform: Windows, Mac, Vista
JGraph is the leading Open Source Java Graph Visualization Library.
JGraph is the leading Open Source Java Graph Visualization Library. It follows Swing design patterns to provide an API familiar to Swing programmers and functionality that provides a range of features. Graph Visualization is a central requirement for applications such as workflow editors, computer and telecommunication networks display, flowcharts, VLSI and CAD,...
Category: Software Development / Components & Libraries
Publisher: JGraph Ltd, License: Freeware, Price: USD $0.00, File Size: 136.0 KB
Platform: Windows, Linux, Mac
Drawing graphs without the right tool is simply difficult.
Drawing graphs without the right tool is simply difficult. uDraw(Graph) automates this task for you. Find out how uDraw(Graph) creates your flow charts, diagrams, hierarchies or structure visualizations using automatic layout - much faster than with any standard drawing program. With the API, uDraw(Graph) can even be embedded in your own programs as a Visualization...
Category: Multimedia & Design / Image Editing
Publisher: University Bremen, FB3, Germany, License: Freeware, Price: USD $0.00, File Size: 2.6 MB
Platform: Windows
CentiBiN is an application for the calculation and Visualization of centralities for biological networks.
Features:
- Computing different vertex and Graph centrality measures
- Visualize a network and the computed centralities with five different layout algorithms
- Display distribution plots and histograms for computed centralities
- Reading and...
Category: Internet / Misc. Plugins
Publisher: Dirk Koschuetzki, IPK Gatersleben, Germany, License: Freeware, Price: USD $0.00, File Size: 4.8 MB
Platform: Windows
Graph Studio is the open source graph drawing/processing software.
Graph Studio is the open source Graph drawing/processing software. It allows users to build and process highly customizable graphs.
Category: Multimedia & Design
Publisher: sourceforge.net, License: Freeware, Price: USD $0.00, File Size: 118.0 KB
Platform: Windows, Mac, Vista
BALLView is a standalone molecular modeling and visualization application.
BALLView is a standalone molecular modeling and Visualization application. Furthermore it is also a framework for developing molecular Visualization functionality. It is available free of charge under the GPL for Linux, Windows and MacOS.
BALLView is a free molecular modeling and molecular graphics tool. It provides fast OpenGL-based Visualization of molecular...
Category: Home & Education / Science
Publisher: Plone Foundation, License: Freeware, Price: USD $0.00, File Size: 38.0 MB
Platform: Windows
Graph constructs, visualizes and modifies graphs as well as calculates measures and layouts.
Graph constructs, visualizes and modifies graphs as well as calculates measures and layouts.
CoSBiLab Graph can construct, visualize and modify graphs as well as calculate measures and layouts. CoSBiLab Graph can import and export data in a variety of formats, among which the reaction network generated by the beta WorkBench.
Category: Multimedia & Design / Multimedia App's
Publisher: CoSBi, License: Freeware, Price: USD $0.00, File Size: 3.1 MB
Platform: Windows
DataPlot is a program where you can import your time based data and graph it.
DataPlot is a program where you can import your time based data and Graph it.You can move easily back and forward in user defined time window, allows individual time setting for each Graph, values read directly in Graph by dragging mouse over the curve and much more
Category: Multimedia & Design / Multimedia App's
Publisher: CBIM, License: Freeware, Price: USD $0.00, File Size: 311.0 KB
Platform: Windows
TwistedPixel is a Visualization plugin for Windows Media Player that uses the system's graphics card to produce stunning 3D visualizations. On the software front, it uses Microsoft's Direct3D to produce flowing images in reaction to music. The Visualization is very well synchronized with the beats. There are around 100+ presets that come pre installed with this plugin,...
Category: Audio / Utilities & Plug-Ins
Publisher: Brian Spangler, License: Freeware, Price: USD $0.00, File Size: 5.7 MB
Platform: Windows
The educational system for Visualization of the elektric and magnetic field in linear homogeneous environment.
Main properties
- Visualization of the elektric and magnetic field
- Visualization of time varying field (planned)
- Solution of trajectory of charged particles in the field (planned)
- Computation of the integral...
Category: Utilities / Misc. Utilities
Publisher: Ing. Pavel Karban, License: Freeware, Price: USD $0.00, File Size: 1.2 MB
Platform: Windows
The WebViewer plug-in enables Windows users whether or not they have SigmaPlot to explore the data used to create the Graph.
Using the WebViewer plug-in with your Web browser window you can:
- View the data used to create the Graph
- Print a Graph in a web document at full resolution
- Zoom in and out of a Graph
- Grab and...
Category: Multimedia & Design / Graphics Viewers
Publisher: SYSTAT Software Inc., License: Freeware, Price: USD $0.00, File Size: 12.6 MB
Platform: Windows
Akuarela is a new data Visualization tool for Ad-Hoc Reporting / Self Service BI that can be used with nearly every available data warehouse. It has been successfully tested with Microsoft Analysis Services and SAP Netweaver BI.
Akuarelas easy-to-use interface allows for the rapid creation of presentation ready reports and interactive dashboards. Next to many other...
Category: Multimedia & Design / Graphics Viewers
Publisher: Christoph Aussem, License: Freeware, Price: USD $0.00, File Size: 1.2 MB
Platform: Windows
With The Option Strategy Builder you could pick up an option and place it directly to the return Graph. As with the online tool, just drag and drop the option on the Graph, and build your strategy. Using your mouse, the options can be easily moved on the Graph to different strike prices, and to different expiration dates.
With this program you can manage your...
Category: Multimedia & Design / Multimedia App's
Publisher: SamoaSky, License: Freeware, Price: USD $0.00, File Size: 3.1 MB
Platform: Windows
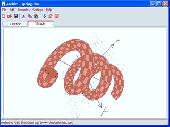
Archim is a program for drawing the graphs of all kinds of functions. You can define a Graph explicitly and parametrically, in polar and spherical coordinates, on a plane and in space (surface). Archim will be useful for teachers and students, as well as for everyone who is interested min geometry. With Archim, you will draw the Graph of any function and form, just use your...
Category: Home & Education
Publisher: Stochastic Lab, License: Freeware, Price: USD $0.00, File Size: 479.6 KB
Platform: Windows
Graph-A-Ping allows you to visually see the ping latency between ping times.
Graph-A-Ping allows you to visually see the ping latency between ping times. The bigger the gap between one ping to another allows you to spot possible network bottle neck.
This tool is actually an applet part of Glass Net Networks monitoring console.
Category: Internet / Misc. Plugins
Publisher: Mataluis.Com, License: Freeware, Price: USD $0.00, File Size: 2.1 MB
Platform: Windows
NetCharts Designer puts thousands of data Visualization design options right at your fingertips for comprehensive chart, Graph, table, dashboard and scorecard design. Automatic data refresh allows for retrieval from multiple data sources simultaneously for real-time updates. Plus Designer connects to virtually any data source, supports multiple development languages (JSP, ASP,...
Category: Multimedia & Design / Fonts
Publisher: Visual Mining, Inc., License: Freeware, Price: USD $0.00, File Size: 28.9 MB
Platform: Windows
The Orbit Visualization Tool (OVT) is a software for Visualization of satellite orbits in the Earth's magnetic field. The program can display satellite orbits in five coordinate systems (GEI, GEO, GSM, SMC, GSE), satellite footprints projected on the Earth's surface and shown in either geographic (GEO) or geomagnetic (SMC) coordinates. In addition to satellite orbits the...
Category: Home & Education / Astrology & Numerology
Publisher: OVT Team, License: Freeware, Price: USD $0.00, File Size: 0
Platform: Windows
VITASCOPE is an acronym for VIsualizaTion of Simulated Construction OPErations.
VITASCOPE is an acronym for Visualization of Simulated Construction OPErations. VITASCOPE is an open, loosely-coupled, user-extensible 3D animation description language designed specifically for 1) Visualizing simulated construction processes and resulting products in 3D; and 2) Developing higher-level construction Visualization tools.
Category: Multimedia & Design / Graphics Viewers
Publisher: Vineet R. Kamat, License: Freeware, Price: USD $0.00, File Size: 29.6 MB
Platform: Windows
Rapid Design Visualization (RDV) is an application developed specifically for use with Autodesk Civil 3D.
RDV enables any Civil 3D user to create a fully interactive Visualization environment directly from their Civil 3D project. Using RDV for Civil 3D designers can easily create drive through simulations, flyovers and interactive simulations for proposed roads,...
Category: Business & Finance / MS Office Addons
Publisher: RDV Systems, License: Freeware, Price: USD $0.00, File Size: 14.7 MB
Platform: Windows
mDraw is a universal, generic Visualization system for automatic generation of highquality drawings of directed networks. mDraw primary objective is to provide a universal Visualization tool for directed biological networks and Visualization of the network motifs embedded in them.
Category: Business & Finance / Applications
Publisher: Weizmann Institute of Science, License: Freeware, Price: USD $0.00, File Size: 1.6 MB
Platform: Windows
Graph Extract is a program for digitizing plots.
Graph Extract is a program for digitizing plots. Using either manual or automated approaches, this program provides a means to easily extract numeric data from plots. The resulting X-Y data can be printed or replotted, or it can be saved in Excel file for
Category: Multimedia & Design
Publisher: quadtechassociates.com, License: Freeware, Price: USD $0.00, File Size: 446.0 KB
Platform: Windows
The NetGraph – network monitor 2.
The NetGraph – network monitor 2.0 is a software network-monitoring program that enables users to see at a glance the activities on their networks including the volumes of traffic with four simple Graph mode indicators.
The program works on any Windows’ network connection and NetGraph – network monitor 2.0’s four modes include 2 snapshot modes and 2...
Category: Internet / Monitoring
Publisher: Nikola Dachev, License: Freeware, Price: USD $0.00, File Size: 0
Platform: Windows
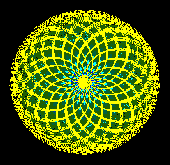
Visualization plugin for WinAmp. Laser effect It is possible to look at it as look at fire.
Visualization plugin for WinAmp. Laser effect It is possible to look at it as look at fire. A dance it not a set of poses. A music it not a set of sounds. Moreover, color music it not conformity to each sound of the certain color. I think it is conformity of change of image to music. SoundGraffiti is an attempt to bring the Visualization closer to the human perception of music.
Category: Audio
Publisher: SoundGraffiti, License: Freeware, Price: USD $0.00, File Size: 662.6 KB
Platform: Windows
MathTrax is a graphing tool for middle school and high school students to Graph equations, physics simulations or plot data files.
The graphs have descriptions and sound so you can hear and read about the Graph. Blind and low vision users can access visual math data and Graph or experiment with equations and datasets.
Category: Business & Finance / Applications
Publisher: The MathTrax Team, License: Freeware, Price: USD $0.00, File Size: 21.0 MB
Platform: Windows
NAViGaTOR (Network Analysis, Visualization, & Graphing TORonto) is a software package for visualizing and analyzing protein-protein interaction networks. NAViGaTOR can query OPHID / I2D - online databases of interaction data - and display networks in 2D or 3D. To improve scalability and performance, NAViGaTOR combines Java with OpenGL to provide a 2D/3D Visualization system on...
Category: Multimedia & Design / Multimedia App's
Publisher: Jurisica Lab, Ontario Cancer Institute, License: Freeware, Price: USD $0.00, File Size: 54.0 MB
Platform: Windows
MILXView is a 3D medical imaging analysis and visualization platform.
MILXView is a 3D medical imaging analysis and Visualization platform.
The MILXView platform was designed and developed to support internal research efforts, provide a viable and robust environment for clinical applications, and to meet the needs of the AEHRC. The AEHRC required a dedicated 3D medical imaging Visualization platform which could be easily customized to deliver...
Category: Multimedia & Design / Multimedia App's
Publisher: CSIRO, License: Freeware, Price: USD $0.00, File Size: 89.6 MB
Platform: Windows
RJS Graph produces professional scientific and mathematical graphs.
RJS Graph produces professional scientific and mathematical graphs. You may study the data with a wide range of data analysis tools. Features include the ability to plot data and equations, fit best fit curves and splines, and display fitted best fit curve parameters. Data can be pasted from a spreadsheet or imported from a text file using a wizard.
Category: Home & Education / Mathematics
Publisher: RJS, License: Freeware, Price: USD $0.00, File Size: 3.7 MB
Platform: Windows
CAVASS is the acronym for Computer Aided Visualization and Analysis Software System.
CAVASS is the acronym for Computer Aided Visualization and Analysis Software System. It is a major modification of 3DVIEWNIX, a portable, platform independent software system. It has stereoscopic interface, an easy interface to other systems such as ITK, Matlab, CAD/CAM, and statistical packages.
CAVASS contains a variety of commonly used image processing, Visualization,...
Category: Home & Education / Miscellaneous
Publisher: Saint Joseph's University, License: Freeware, Price: USD $0.00, File Size: 11.8 MB
Platform: Windows
LightConverse software offers real-time, photo-realistic 3D visualization of any type of show.
LightConverse software offers real-time, photo-realistic 3D Visualization of any type of show. Features include realistic-looking fixtures, photometric rays and gobo Visualization, fixture constructor, video inputs, animated objects, animated fog, customizable 3D libraries. Software updates are free of charge for life. The realism and speed are the best in the industry.
Category: Multimedia & Design / Graphics Viewers
Publisher: LightConverse LTD, License: Freeware, Price: USD $0.00, File Size: 388.7 MB
Platform: Windows
T&D Graph has been designed as a user friendly software which brings users even more effective tools for the management and analysis of data recorded by T&D Data Loggers. It contains a variety of useful functions including the ability to read and merge multiple data files and display recorded data in Graph and/or list form.
Category: Software Development / Misc. Programming
Publisher: T&D CORPORATION, License: Freeware, Price: USD $0.00, File Size: 11.3 MB
Platform: Windows
LumiDMX X13D is a real-time 3D software for pre-visualization of light and multimedia shows.
LumiDMX X13D is a real-time 3D software for pre-Visualization of light and multimedia shows. By using latest 3D Gaming Technologies, X13D reaches a nearly photorealistic level of reality. From Visualization of a mobile DJ stage to a complete simulation of a theatre, X13D makes it possible and this in real time.
Category: Multimedia & Design / Multimedia App's
Publisher: FreeStylers Innovations GmbH., License: Freeware, Price: USD $0.00, File Size: 159.4 MB
Platform: Windows
Function Analyzer is a program that draws the Graph of a function with one variable declared by the user. The operators used to build the mathematical expression are the usual ones used in software calculators: * for multiplying, / for dividing, ^ for power and so on. Parentheses can be used to group terms in your expression. Trigonometric functions are also supported, along with a few...
Category: Home & Education / Mathematics
Publisher: Lorenzi Davide, License: Freeware, Price: USD $0.00, File Size: 1.3 MB
Platform: Windows
A Windows Media Player visualization plug-in for your Light-O-Rama controller.
A Windows Media Player Visualization plug-in for your Light-O-Rama controller.
LORVis is a Visualization plug-in for Windows Media Player that will utilize a Light-O-Rama controller to synchronize your christmas lights with live music.
You can connect your lights in any fashion you want. The plugin typically will use channels 1 through 6 to represent a linear effect of...
Category: Audio / Music Creation
Publisher: Merit Wilkinson, License: Freeware, Price: USD $0.00, File Size: 159.5 KB
Platform: Windows
SpacEyes3D Viewer is a free software dedicated to interactive Visualization of 3D models created with SpacEyes3D Builder. The interface is simplified for end-user Visualization and consultation.
Category: Multimedia & Design / Illustration
Publisher: spaceyes.com, License: Freeware, Price: USD $0.00, File Size: 18.7 MB
Platform: Windows, Mac, Vista
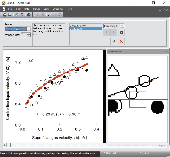
Obtain data from images of graphs scanned from articles or available as image. Import the Graph into ScanIt from a scanner or file, or from the clipboard. Define locations of the Graph's axes by indicating known points. Extract data from the Graph by manually picking points, by scanning for points or by scanning along curves. Copy the scanned data to Excel or export data to...
Category: Home & Education / Science
Publisher: amsterchem, License: Freeware, Price: USD $0.00, File Size: 6.1 MB
Platform: Windows
JavaView is a 3D geometry viewer and a mathematical visualization software.
JavaView is a 3D geometry viewer and a mathematical Visualization software. The web-integration allows display of 3D geometries and interactive geometry experiments in any HTML document on the internet. JavaView also runs as application on local computers from a Unix or Dos command prompt. The open API of JavaView enables a smooth integration as 3D viewer and advanced...
Category: Web Authoring / JavaScript
Publisher: Konrad Polthier, License: Freeware, Price: USD $0.00, File Size: 8.4 MB
Platform: Windows


 Freeware
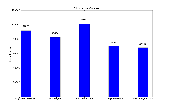
Free Graph Generator is a simple bar chart generation tool that lets you create custom bar charts of any size. Edit bar color, bar width, bar title, and bar side label properties.
Category: Home & Education / Mathematics
Publisher: Innovative Creations Software, License: Freeware, Price: USD $0.00, File Size: 16.5 MB
Platform: Windows
The Landscape Management System (LMS) is an evolving application designed to assist in landscape level analysis and planning of forest ecosystems by automating the tasks of stand projection, graphical and tabular summarization, stand Visualization, and landscape Visualization. LMS is implemented as a Microsoft Windows (TM) application that coordinates the activities of other...
Category: Business & Finance / MS Office Addons
Publisher: University of Washington, License: Freeware, Price: USD $0.00, File Size: 67.5 MB
Platform: Windows
Real-time monitoring and statistics for Apache® HTTP server. HSLAB HTTP Monitor is a complete solution for Visualization of the connections and performance data for Apache servers Web in real time. The information is collects remotely, the server and the HTTP Monitor can works in different places without any restrictions. This software connects to the Web server and receives from it...
Category: Internet
Publisher: Handy Software Lab, License: Freeware, Price: USD $0.00, File Size: 1.6 MB
Platform: Windows
Biorhytm is a small application that generates your biorhytm status.
Biorhytm is a small application that generates your biorhytm status.
Enter your birthday and a Graph will reveal your
bio health, with charts and lines displaying your physical, intellectual and emotional state as well. You can save result Graph to BMP file.
Category: Home & Education / Astrology & Numerology
Publisher: aOlej, License: Freeware, Price: USD $0.00, File Size: 389.0 KB
Platform: Windows
InfoScope allows users to easily analyze, compare, query, and explore large or complex datasets . InfoScope is a highly interactive Visualization tool that shows the big picture by providing an overview of the essential relationships, encourages the explorative discovery of in the overall context, and supports our way of thinking and working by taking advantage of the human perceptual...
Category: Business & Finance
Publisher: Macrofocus GmbH, License: Freeware, Price: USD $0.00, File Size: 18.7 MB
Platform: Windows, Mac, Linux, Unix, Java
iTraffic Monitor is a network monitor and reporting tool.
iTraffic Monitor is a network monitor and reporting tool. It provides real time Graph of network traffic. Detailed stats provide daily/weekly/monthly/yearly stats.
Main features:
- Monitor and review your Internet or network bandwidth usage with ease.
- How fast your internet connection? We can Graph it for your review.
- How much data do yo u...
Category: Internet / Monitoring
Publisher: Charles DeWeese, License: Freeware, Price: USD $0.00, File Size: 1.1 MB
Platform: Windows
SAOImage DS9 is an astronomical imaging and data visualization application.
SAOImage DS9 is an astronomical imaging and data Visualization application. DS9 supports FITS images and binary tables, multiple frame buffers, region manipulation, and many scale algorithms and colormaps. It provides for easy communication with external
Category: Home & Education / Mathematics
Publisher: hea-harvard.edu, License: Freeware, Price: USD $0.00, File Size: 13.2 MB
Platform: Windows, Mac, Vista
PeCo-Graph is the software for the procurement and graphical visualisation of the counting data from one or multiple PeCo range units. An easy-to-use application for PC that eases the download of the counting data and simplifies their analysis and graphical representation.
It has multiple charts to easily make presentations, for instance, with comparisons of the data acquired in...
Category: Business & Finance / Business Finance
Publisher: Visual Tools S.A., License: Freeware, Price: USD $0.00, File Size: 3.3 MB
Platform: Windows
Quickmenu 5 is a modern ergonomic visualization tool for designing of the display masks.
Quickmenu 5 is a modern ergonomic Visualization tool for designing of the display masks. It is self-describing to learn easily and intuitively operably. Unicode16, password administration, error message system, trendviewing and - histories, prescription administration.
Category: Software Development / Help File Utilities
Publisher: Berthel GmbH, License: Freeware, Price: USD $0.00, File Size: 15.3 MB
Platform: Windows
This free program plots in realtime all data sent and received using the Dial-Up Networking Adapter and Modem. Shows separate sent, received, send rate, received rate, peaks and totals. Five graphs and statistics. Animated System Tray Icon. Allows you to change colours, Graph size, sample seconds, 3D Graph, axis and more. Full automated self-upgrade. Autostart with Win95/98. Now...
Category: Internet / Dial-up & Connectivity
Publisher: Ashok Kumar Parmar, License: Freeware, Price: USD $0.00, File Size: 819.2 KB
Platform: Windows
Zortam Mp3 Player will enable you to listen all your favorite tracks and at the same time enjoy a show of lights and images visualizing the covers of your albums and song lyrics.You can add additional Visualization plugins using Zortam Visualization SDK .You can watch scrolling lyrics and cover arts together with different visualizations or static jpg backgrounds while playing...
Category: Audio / Audio Players
Publisher: Zortam, License: Freeware, Price: USD $0.00, File Size: 6.5 MB
Platform: Windows
The Library GraphDiag is intended for building Graph and diagrams on HBITMAP, surface DirectDraw and in file BMP format. The Library can build the graphs on entered text line and diagrams, as from tables, which format is provided by developer, so and from files HTML-format and from XLS files Excel. Given version first and is not deprived defect and restrictions. The Restrictions are of...
Category: Software Development / Components & Libraries
Publisher: Kruchinin Aleksandr, License: Freeware, Price: USD $0.00, File Size: 67.0 KB
Platform: Windows
Atlantis Schema Surf is our SQL dependency & live entity ER diagram tool - it is a free animated graphing tool which allows you to easily visualize the dependencies between the objects in your SQL Server databases in a live entity ER diagram.
Schema Surf, like it's counterpart Data Surf, contains a "Surf Graph" which allows you to easily view an object and the...
Category: Business & Finance / Database Management
Publisher: Atlantis Interactive UK Ltd., License: Freeware, Price: USD $0.00, File Size: 7.4 MB
Platform: Windows
WTides is a free program that uses harmonics data to predict tide heights at many locations throughout the World, and displays a Graph of the results according to the time zone of the target location. The tide Graph can be overlaid with a solunar chart to give an interesting version of the Maori Fishing Calendar. The program runs on any version of Microsoft Windows from Windows 95.
Category: Multimedia & Design / Digital Media Editors
Publisher: Managing Data Resources (NZ) Ltd, License: Freeware, Price: USD $0.00, File Size: 601.9 KB
Platform: Windows

