Free Downloads: Excel Graphs And Charts
3D Graphs & Charts is a series of Charting components which can be used bothin intranet and internet web pages. The comprehensive documentation clearlydemonstrates how to implement each component. With the examples (which include documented html code) you will quicklybe able to incorporate these powerful components into your own pages.
Category: Internet / Tools & Utilities
Publisher: Sirius Computer Consultants Limited, License: Demo, Price: USD $30.00, File Size: 130.0 KB
Platform: Windows
OfficeReports makes it easy to create Charts, tables in Excel in the layout you like! No matter if you have your data in Excel or SPSS format, or would like to connect directly to your SurveyMonkey survey. OfficeReports has all the functionality for the statistical analysis, including t-Test and Z-test. You can create your own layout definitions, and create your...
Category: Business & Finance / Business Finance
Publisher: OfficeReports, License: Shareware, Price: USD $999.00, File Size: 609.0 KB
Platform: Windows
Fast, Powerful and Flexible, E-Tabs Enterprise automates the production of Charts, Graphs, and summary reports directly from your research data. Automating your reporting with Enterprise ensures accuracy and saves time because manual tasks that leave room for error such as hand entry or tools offering only partial automation are no longer necessary.Any researcher will be aware of...
Category: Audio / Utilities & Plug-Ins
Publisher: E-Tabs, License: Demo, Price: USD $0.00, File Size: 139.1 KB
Platform: Windows
Xplotter is a general purpose scientific graphing program for Windows.
Xplotter is a general purpose scientific graphing program for Windows. A wide variety of options allow the Graphs to be customized to your requirements.
- Windows 2000, XP, Vista, Windows 7
- Plot XY, XY Line, Bar, Log-Log, Log-Linear, - Ternary and Diamond Graphs
- All Charts in 2D and 3D
- Statistics Including Minima, Maxima, Median, Mean, Standard...
Category: Home & Education / Miscellaneous
Publisher: MinServ, License: Shareware, Price: USD $110.28, File Size: 3.0 MB
Platform: Windows
Sigma XL is a Microsoft Excel third-party add-in that allows statistical professionals to enhance basic Excel's Charts and reports. Excel is the common application to enter data and gather most numerical information, however, its statistical reports functionality is limited, as the data must be exported to other application to get specific reports/Charts....
Category: Business & Finance / Applications
Publisher: SigmaXL, License: Shareware, Price: USD $249.00, File Size: 47.7 MB
Platform: Windows
Web Enabled solution for creating Stacked Horizontal Charts & Graphs.
Web Enabled solution for creating Stacked Horizontal Charts & Graphs. Versatile components for web authors and developers to easily build and publish dynamic and interactive bar Graphs. Database Access Methods (Direct Data Binding and Multi-Tier)Template Scripts and Implementations (ASP, JSP, PHP and Servlet Code)Documentation, Demo Implementations and Tutorial...
Category: Software Development / Tools & Editors
Publisher: Sirius Computer Consultants Limited, License: Shareware, Price: USD $49.95, File Size: 252.0 KB
Platform: Windows
Add Powerful reporting features to your Web / Intranet pages and applications. With advanced graphing you will be quickly adding impressive and dynamic charting capabilities bringing your data alive ! The PHP graphing scripts provide a very easy way to embed dynamically generated Graphs and Charts into PHP applications and HTML web pages.Very easy to use and add professional...
Category: Software Development
Publisher: Sirius Computer Consultants Limited, License: Shareware, Price: USD $345.00, File Size: 1.5 MB
Platform: Windows, Mac, Linux, OS/2, Unix
Students use InspireData® to investigate, analyse, and represent data and information in dynamic Graphs and Charts. InspireData tools make it easy to change variables and plot types so students can explore data in multiple, meaningful ways. This encourages them to investigate data analytically, ask more questions, and apply their understanding of the data to form better...
Category: Home & Education / Teaching Tools
Publisher: Inspiration Software, Inc., License: Shareware, Price: USD $79.00, File Size: 30.8 MB
Platform: Windows
Excel file repair software retrieves charts, images, and the engineering formulas.
Excel file repair software retrieves Charts, images, and the engineering formulas. It can retrieve all the text, tables, numbers from the original Excel sheet. It can retrieve the clip arts. It supports windows 2000, vista, 7, xp, NT, 2003, etc. It employs the high end scanning technologies to repair the objects of Excel sheet such as Charts, images, clip...
Category: Utilities / System Utilities
Publisher: Repair excel file, License: Shareware, Price: USD $49.00, File Size: 3.0 KB
Platform: Windows
The Gantt Chart Builder System provides a system to build professional quality Gantt Charts without the need for Microsoft Project or similar products.Charts can be constructed with either Microsoft Excel or Access. This version is the Access version. Quite often, your data is present in a database and the production of such Charts has been extremely difficult...
Category: Business & Finance / Project Management
Publisher: Bandwood Pty Limited, License: Demo, Price: USD $59.95, File Size: 4.9 MB
Platform: Windows
 Freeware
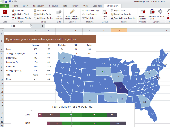
Free standalone software DataPult Desktop creates heat maps from your data quickly and efficiently. Key features: Direct data import from MS Excel with one click. The ability to create animated maps of data over several years. Interactive maps and diagrams. 39 map colorings for making heat maps. Intelligent identification of input regions and automatic...
Category: Business & Finance / MS Office Addons
Publisher: DataPult, License: Freeware, Price: USD $0.00, File Size: 21.0 MB
Platform: Windows
GraPL is a professional charting engine which produces high-quality Graphs, ideal for publication in journals and magazines, inclusion in other documents or deployment on the Internet in the VML or SVG vector formats as well as conventional images. By simplifying the process of making standard Charts (barcharts, pie Charts, timeseries ...), GraPL makes it easy to create...
Category: Multimedia & Design / Multimedia App's
Publisher: Causeway Graphical Systems Ltd., License: Shareware, Price: USD $72.00, File Size: 5.3 MB
Platform: Windows
GetData Graph Digitizer is a program built for getting raw data out of visual Graphs for analytical purposes. Most of the comparative data are usually visualized by Graphs and Charts. This software helps you in converting these visual data in to figures and export in to sheets in desired formats.
The software works on simple procedure of opening the targeted...
Category: Business & Finance / Database Management
Publisher: getdata-graph-digitizer.com, License: Shareware, Price: USD $30.00, File Size: 1.0 MB
Platform: Windows
FusionCharts Free is a flash charting component that can be used to render data-driven & animated Charts for your web applications and presentations. It is a cross-browser and cross-platform solution that can be used with ASP.NET, ASP, PHP, JSP, ColdFusion, Ruby on Rails, simple HTML pages or even PowerPoint Presentations to deliver interactive and powerful flash Charts. You...
Category: Software Development
Publisher: InfoSoft Global (P) Ltd., License: Freeware, Price: USD $0.00, File Size: 2.7 MB
Platform: Windows, Mac, Linux,
Excelential is dashboard software that posts the key contents of your current Excel spreadsheets on a dashboard. That’s right. Cells and Charts from the many spreadsheets you create, receive, or work with today. They go right on to the dashboards– no modifications to the Excel spreadsheets necessary. You continue to enjoy all the features and power of...
Category: Business & Finance / Database Management
Publisher: Changes and Trends Software, Inc., License: Shareware, Price: USD $49.00, File Size: 2.9 MB
Platform: Windows
DPLOT95 is a software for creating and manipulating graphs in 1, 2, 3, and 4-D.
DPLOT95 is a software for creating and manipulating Graphs in 1, 2, 3, and 4-D. With its help you you can create presentation-quality Graphs as well as contour plots of 3-D and 4-D data while using data from a variety of sources. You can use multiple scaling types, including linear, logarithmic, and probability scales on the X and/or Y axes. DPlot also provides several special...
Category: Multimedia & Design / Multimedia App's
Publisher: USAERDC, License: Shareware, Price: USD $195.00, File Size: 9.9 MB
Platform: Windows
The Project Planner reader allows the PPR files to be viewed as Gantt Charts, Network diagrams, Cost / Resource Graphs etc. In order to understand how you and your customers can benefit from the project planner reader and SmartWorks please go through the article on sharing project plans.
Category: Business & Finance / Business Finance
Publisher: Accord Software & Systems Inc., License: Shareware, Price: USD $0.00, File Size: 0
Platform: Windows
Accepts gif, jpg, and several other picture formats. Alsocontains a measurement function to measure from point to point on a scaled picture (micrograph, map, schematic). Output is displayed realtime next to the picture and can be formatted as numeric, scientific, dates, times, or general.
Category: Home & Education / Mathematics
Publisher: datatrendsoftware, License: Freeware, Price: USD $0.00, File Size: 157.0 KB
Platform: Unknown
Freeware
MyOra is a free SQL Tool for Oracle database developers and DBAs. This tool is simple, fast and easy to use, requires no installation, no Oracle client and no internet connection. Just download, unzip and start using with a click of the mouse, run SQL queries and Monitor database performance in Real Time. MyOraâs MDI (Multi Document Interface) framework handles multiple sub-windows opened at...
Category: Software Development / Databases & Networks
Publisher: Jayam Systems, LLC, License: Freeware, Price: USD $0.00, File Size: 1.0 MB
Platform: Windows
Building on the industry-standard spreadsheet, Analyse-it extends Excel with statistics and Charts for visualising, describing and testing hypotheses on your data. The ease-of-use of Analyse-it, combined with the power of Excel, makes a formidable statistics package. With the easy-to-read help and Getting Started tutorials you'll be using Analyse-it on your own data in...
Category: Business & Finance / Personal Finance
Publisher: Analyse-it Software, Ltd., License: Demo, Price: USD $185.00, File Size: 5.7 MB
Platform: Windows
US Mileage Charts and Tables in Excel format, including travel times and distances for both the fastest and shortest routes. Includes sets of tables for every US State, and one large pan-US chart. Total: 204 tables in 51 files. Over half a million distances and times. Data is supplied in a zip of industry-standard Excel formats to allow easy accessibility. Cities are...
Category: Business & Finance
Publisher: Winwaed Software Technology LLC, License: Data Only, Price: USD $20.00, File Size: 1.2 MB
Platform: Unknown
The big kahuna. It's got everything. All the functionality of Shaft Selector (SS) and Tapes And Charts (TAC), plus four additional tabs that cover ballistics Charts and Graphs, target simulation scenarios, how to accurately estimate unmarked distances, and access to some of the important system variables.
Requirements:
- Windows...
Category: Games / Simulations
Publisher: Pinwheel Software, Inc, License: Shareware, Price: USD $0.00, File Size: 0
Platform: Windows
UNaSCANaIT digitizer software works with most image formats (TIFF, JPG, BMP, GIF, etc.
UNaSCANaIT digitizer software works with most image formats (TIFF, JPG, BMP, GIF, etc.) from any scanner, digital camera, or other image source to digitize plots, strip Charts, instrumental output, old Graphs, published Graphs, etc. In addition to the many graph digitizing features, UNaSCANaIT also integrates peak areas, smoothes data, takes derivatives, reascales...
Category: Multimedia & Design / Multimedia App's
Publisher: Silk Scientific, Inc., License: Shareware, Price: USD $445.00, File Size: 12.7 MB
Platform: Windows
Java Chart Designer is a powerful charting Java application that empowers you with all necessary tools to create Charts for professionally looking presentations, business and scientific reports that can be easily integrated into website as Java applet, Java applications or saved as JPEG images. A user-friendly interface, great number of visual effects and predefined chart types, flexible...
Category: Business & Finance
Publisher: ELTIMA Software GmbH, License: Shareware, Price: USD $99.95, File Size: 2.8 MB
Platform: Windows
Make reports with professional look.
Make reports with professional look. Spreadsheet Presenter will do it easier.
Spreadsheet Presenter will allow you to customize your Charts and reports in MS Excel as you want. You will have available many tools to improve your worksheets for your presentations and more.
With this ease of use add-in for MS Excel you will be able to redesign the look and feel of...
Category: Business & Finance / MS Office Addons
Publisher: Model Advisor, License: Shareware, Price: USD $49.95, File Size: 16.7 MB
Platform: Windows