Free Downloads: Function Plot
Rt-Plot is a tool to generate Cartesian X/Y-plots from scientific data.
Rt-Plot is a tool to generate Cartesian X/Y-plots from scientific data. You can enter and calculate tabular data. View the changing graphs, including linear and non linear regression, interpolation, differentiation and integration, during entering. Rt-Plot enables you to create plots fast and easily. The line calculations give full access to calculation and display ranges and can...
Category: Home & Education / Mathematics
Publisher: Rt-Science, License: Shareware, Price: USD $29.90, File Size: 5.2 MB
Platform: Windows
AutoPlot allows users to Plot off large drawing sets with just a few key strokes.
AutoPlot allows users to Plot off large drawing sets with just a few key strokes. AutoPlot Automatically builds an AutoCad script file that allows the user to print / Plot off large drawing sets with just a few key strokes. Easy to use explorer style point and click for drawing selections. AutoScript setup editor allows the user to customize scripts for plotting. You can try out...
Category: Utilities / System Utilities
Publisher: US Automation Inc., License: Shareware, Price: USD $39.95, File Size: 5.5 MB
Platform: Windows

 Shareware
Sicyon is all-in-one scientific calculator for every student and professor, researcher and developer. The core of Sicyon is an expression (VBScript/JScript) calculator with features as: estimate a Function using variables, user-defined functions and Sicyon objects; multi-Plot/tabulate a Function; solve 1-6 equations, minimums, maximums and definite integral of 2D/3D...
Category: Home & Education / Mathematics
Publisher: SpecLabs, License: Shareware, Price: USD $28.00, File Size: 10.8 MB
Platform: Windows
Cumulative Probability Plot does all of the statistical mathematics for you and outputs the data in a visual format that can be easily interpreted by people with a limited knowledge of statistics.
The graph is also useful for a quick demonstration to regulators or other interested parties that your product or process is within acceptable tolerance or meets regulatory limits.
Category: Multimedia & Design / Multimedia App's
Publisher: Rad Pro Calculator, License: Freeware, Price: USD $0.00, File Size: 8.8 MB
Platform: Windows
The science-fiction plot of the movie became one of the most favorite ones for many people.
The science-fiction Plot of the movie became one of the most favorite ones for many people. The sequel, released in 2009, gives us a new opportunity to plunge into atmosphere of the future and follow the confrontation of the two worlds.
Category: Desktop Enhancements / Screensavers
Publisher: 3d-screensaver-jam.com, License: Freeware, Price: USD $0.00, File Size: 2.0 MB
Platform: Windows, Mac, 2K, 2K3, Vista
Edit, plot and store tables of n,k vs.
Edit, Plot and store tables of n,k vs. wavelength for subsequent use in DESIGN. Built-in index functions (Lorentz, Sellmeier, etc.) can be plotted and fitted to these n,k tables.
The extensive Sopra (537K) database of ellipsometrically determined index tables is included.
Category: Multimedia & Design / Video
Publisher: FTG Software Associates, License: Freeware, Price: USD $0.00, File Size: 536.5 KB
Platform: Windows
Thanks to the technology of the Moultrie Plot Stalker and time-lapse photography, you can see a full day of activity condensed to a 10-minute video clip. Now you can see what happens on your green field or favorite hunting spot even when you're not there.
Category: Utilities / Misc. Utilities
Publisher: EBSCO Industries, Inc., License: Shareware, Price: USD $49.99, File Size: 10.3 MB
Platform: Windows
Excel Graph Multiple Equations Software is an application that allows you to Plot multiple functions in Microsoft Excel. It is able to create multiple charts based on the formulas entered. You can enter an equation manually or load multiple equations from a text file (.txt). The application is able to Plot each equation on an individual graph or all the equations on a single...
Category: Business & Finance / MS Office Addons
Publisher: Sobolsoft, License: Shareware, Price: USD $19.99, File Size: 2.5 MB
Platform: Windows
Panoply is a Java application which enables the user to Plot raster images of geo-gridded data from netCDF datasets. Panoply is an utility that enable user to Plot raster image. Depending on the data, it can draw global longitude-latitude images or pole-t
Category: Multimedia & Design / Illustration
Publisher: giss.nasa.gov, License: Freeware, Price: USD $0.00, File Size: 9.4 MB
Platform: Windows, Mac, 2K, 2K3, Vista
Visual Calculus is a grapher to compute and graph limit, derivative, integral, 3D vector, partial derivative Function, series, ODE etc.Pre-calculus: functions, piecewise defined Function, even and odd functions, polynomials, rational functions.The program has the Ability to set and modify the properties of coordinate graphs, animations and table graphs.Also the ability to move,...
Category: Home & Education / Mathematics
Publisher: GraphNow Software, License: Shareware, Price: USD $60.00, File Size: 3.4 MB
Platform: Windows
PLT Export for SolidWorks is a HPGL Plot PLT file export add-in for SolidWorks®. This add-in gives SolidWorks the ability to export geometric data from a SolidWorks drawing document to a HPGL PLT file. PLT Export for SolidWorks reads curve data from a SolidWorks drawing document and converts it into corresponding pen movements in a HPGL Plot file. PLT Export for SolidWorks...
Category: Multimedia & Design
Publisher: SYCODE, License: Commercial, Price: USD $195.00, File Size: 1.1 MB
Platform: Windows
LAB Fit is a software for Windows developed for treatment and analysis of experimental data.
LAB Fit is a software for Windows developed for treatment and analysis of experimental data. At LABFit program you are able to:
1) Treat similar data (grouped and ungrouped dataset, one or two samples);
2) Treat non-similar data;
3) Determine propagated error (error propagation up to eight independent variables);
4) Plot 2D and 3D graph (normal, parametric, imported...
Category: Home & Education / Science
Publisher: Wilton Pereira da Silva, License: Shareware, Price: USD $60.00, File Size: 3.3 MB
Platform: Windows
The easiest way to get a paper map with MapPlot is the Plot Map menu.
The easiest way to get a paper map with MapPlot is the Plot Map menu.
On the following dialog, simply paper size and scale have to be chosen - the result is ready to be printed directly, edited (e.g. for additional entries) or to be displayed as a preview.
Category: Utilities / Misc. Utilities
Publisher: AGIS GmbH, License: Freeware, Price: USD $0.00, File Size: 5.4 MB
Platform: Windows
A method of moment program that can be used for analysing planar conducting structures (such as e.
A method of moment program that can be used for analysing planar conducting structures (such as e.g. printed circuit boards) in free space or on a grounded dielectric substrate.
The program computes the current distribution, in the frequency domain, on the conducting patches due to either exciting voltage sources or an exciting incident plane wave.
Also the near...
Category: Multimedia & Design / Multimedia App's
Publisher: SP Technical Research Institute of Sweden,, License: Freeware, Price: USD $0.00, File Size: 1.4 MB
Platform: Windows
DeadLine is a free program useful for solving equations, plotting graphs and obtaining an in-depth analysis of a Function. Designed especially for students and engineers, the freeware combines graph plotting with advanced numerical calculus, in a very intuitive approach. Most equations are supported, including algebraic equations, trigonometric equations, exponential equations,...
Category: Audio
Publisher: Ionut Alex. Chitu, License: Freeware, Price: USD $0.00, File Size: 1.4 MB
Platform: Windows
GerberView is an application that allows you to view multiple Gerber photo Plot layers (files) and an NC drill file simultaneously. You can also specify aperture and drill sizes. It is a Windows based application, which allows you to view Gerber Plot and NC Drill files.
Category: Multimedia & Design / Multimedia App's
Publisher: AceBus, License: Demo, Price: USD $0.00, File Size: 1.8 MB
Platform: Windows
Sample Champion is a powerful real-time software tool designed for high precision acoustic measurements. With Sample Champion you will be able to measure the Impulse Response of a room, or analyze loudspeaker Frequency Responses using the MLS (Maximum Length Sequence) method. It has been designed for acoustical technicians, sound engineers, scientists and students. Sampling rate 5 kHz up to...
Category: Audio
Publisher: Purebits, License: Shareware, Price: USD $199.00, File Size: 3.6 MB
Platform: Windows
Oil Tycoon!TM is a business simulation in which your rich Texas uncle died and left you an inheritance of one Plot of land, one oil well, one refinery, one storage unit, and one million dollars.
His will stated the following advice - buy low, sell high... Use this advice to grow a simple family-run business into a huge corporation.
Since it has been created in...
Category: Games / Simulations
Publisher: Rocky Mountain Systems, License: Freeware, Price: USD $0.00, File Size: 16.6 MB
Platform: Windows
LiveGraph is a framework for real-time data visualisation, analysis and logging. Distinctive features: - A real-time plotter that can automatically update graphs of your data while it is still being computed by your application. - Concise and simple point-and-click interface that allows to quickly select and compare data series even in applications that output over 1000 series...
Category: Home & Education / Science
Publisher: LiveGraph open-source project, License: Freeware, Price: USD $0.00, File Size: 889.0 KB
Platform: Windows, Mac, Linux
Z-Plot is a free plotting software that allows you to visualize a multitude of mathematical functions and curves. The software has a powerful mathematical formula interpreter, that also allows the user to handle complex numbers, easily. The display can be switched from 2D to 3D mode. Additionally, diagrams can be made from a data table. Selected program features:-3D/2D display that be...
Category: Home & Education / Mathematics
Publisher: Reinhard Nopper, License: Freeware, Price: USD $0.00, File Size: 778.2 KB
Platform: Windows
Gnuplot.py is a Python package that interfaces to gnuplot, the popular open-source plotting program. It allows you to use gnuplot from within Python to Plot arrays of data from memory, data files, or mathematical functions. If you use Python to perform computations or as 'glue' for numerical programs, you can use this package to Plot data on the fly as they are computed....
Category: Multimedia & Design / Multimedia App's
Publisher: pythonxy.com, License: Freeware, Price: USD $0.00, File Size: 193.3 KB
Platform: Windows
Microsoft Mathematics Add-in for Word and OneNote makes it easy to Plot graphs in 2D and 3D, calculate numerical results, solve equations or inequalities, and simplify algebraic expressions in your Word documents and OneNote notebooks.
The Microsoft Mathematics Add-in can help you with the following tasks:
Compute standard mathematical functions, such as roots and...
Category: Home & Education / Mathematics
Publisher: Microsoft, License: Freeware, Price: USD $0.00, File Size: 6.6 MB
Platform: Windows
FreewareSimplexNumerica is an object-oriented numerical data analyzer, Plot and presentation program. SimplexNumerica is proving to be extremely popular among scientists. Ergonomic programming using the newest Windows programming guidelines with toolbars, context dialogs and interactive diagrams providing easy handling with difficult numeric mathematics. SimplexNumerica is best suited for...
Category: Home & Education / Mathematics
Publisher: Dipl.-Phys.-Ing. Ralf Wirtz, License: Freeware, Price: USD $0.00, File Size: 21.8 MB
Platform: Windows
View Biorhythms of celebrities, family and friends or see how compatible you are with them. . .
Category: Home & Education / Miscellaneous
Publisher: Retro Software Designs, License: Shareware, Price: USD $28.90, File Size: 2.0 KB
Platform: Unknown
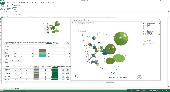
Create stunning 3D bubble charts in Excel with 5dchart Add-In! 5dchart Add-In for Microsoft Excel is an easy-to-use tool for multi-dimensional data visualization. It allows you to display a 3D bubble chart with two additional parameters: 3D coordinates of each bubble and bubble size and colour. Of course, it is the easy way to create 3D scatter Plot too. 5dchart Add-In is designed to...
Category: Business & Finance / MS Office Addons
Publisher: System Approach Ltd., License: Shareware, Price: USD $99.90, File Size: 809.0 KB
Platform: Windows