Free Downloads: Reporting Services Scatter Chart
 Shareware
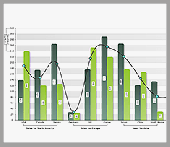
Nevron Chart for SQL Server Reporting Services (SSRS) is an advanced report item, delivering a complete set of 2D and 3D charting types, highly customizable axes, tight data integration and unmatched visual effects to your reports. It instantly improves your report authoring experience, with its polished visual editors, exhaustive and refined settings and well-organized...
Category: Business & Finance / Database Management
Publisher: Nevron Software LLC, License: Shareware, Price: USD $889.00, File Size: 182.2 MB
Platform: Windows
Nevron Chart for SQL Server Reporting Services (SSRS) is an advanced report item, which delivers a complete set of 2D and 3D charting types, highly customizable axes, tight data integration and unmatched visual effects to your reports. It also instantly improves your report authoring experience, with its polished visual editors, exhaustive and refined settings and...
Category: Business & Finance / Database Management
Publisher: Nevron Software, License: Shareware, Price: USD $889.00, File Size: 11.8 MB
Platform: Windows
Create stunning 3D bubble charts in Excel with 5dchart Add-In! 5dchart Add-In for Microsoft Excel is an easy-to-use tool for multi-dimensional data visualization. It allows you to display a 3D bubble Chart with two additional parameters: 3D coordinates of each bubble and bubble size and colour. Of course, it is the easy way to create 3D Scatter plot too. 5dchart Add-In is designed...
Category: Business & Finance / MS Office Addons
Publisher: System Approach Ltd., License: Shareware, Price: USD $99.90, File Size: 809.0 KB
Platform: Windows
Shareware
BAT Desktop is a Business Intelligense software for data visualization and OLAP Reporting. You can analyze your data by building pivot tables, charts, treemaps, Scatter diagrams, filtering/sorting/searching for patterns, etc. Product features: - Reports are generated quickly on a vast amount of data; - You can easily perform ad-hoc Reporting on your own without...
Category: Business & Finance / Applications
Publisher: BIT Impulse, License: Shareware, Price: USD $149.00, File Size: 28.7 MB
Platform: Windows
Silverlight Viewer for Reporting Services is the first product on the market which provides the ability to view Reporting Services reports in Silverlight applications. This is a native Silverlight control that easily integrates into any Silverlight application. Thus, it is possible to use the whole set of features which are, as a rule, available in the classical...
Category: Multimedia & Design / Graphics Viewers
Publisher: Perpetuum Software, License: Shareware, Price: USD $0.00, File Size: 0
Platform: Windows
Shareware
XML Flash charts are easy to make using Animated Chart Pro. Create dynamic web Chart with live data permanently updated from XML source. Animated Chart Pro edition generates real time web charts using dynamic data and all you have to do is to customize Chart appearance, get the result and embed an interactive dynamic flash Chart into your Web page. Flash...
Category: Web Authoring / Website Animation Tools
Publisher: Flarium, License: Shareware, Price: USD $69.00, File Size: 2.7 MB
Platform: Windows
Commercial
Charting tool for the rapid design of 13 different Chart types, including bar, dot, horizontal bar, line, pie, donut, Scatter, xy, area, histogram, error bar, bubble, gantt and volume charts. Additional features include 3D, multiple datasets, gradients, transparency, unlimited annotations, and smoothing. Can be exported to files of types BMP, GIF, PNG, PS, PDF, EMF, JPG, SVG....
Category: Business & Finance / Applications
Publisher: Creative-PC, License: Commercial, Price: USD $49.00, File Size: 7.6 MB
Platform: Windows
In this course, you will learn how to use SQL Server 2005 Reporting Services to create, execute, and manage reports. You will learn how to create tabular, matrix (cross-tab), and Chart reports using Visual Studio 2005 and SQL Server 2005 Business Intelligence Studio.
Category: Home & Education / Miscellaneous
Publisher: AppDev Products, LLC, License: Shareware, Price: USD $0.00, File Size: 0
Platform: Windows
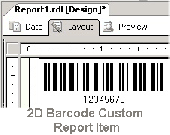
This integrated drag-and-drop Custom Report Item (CRI) control creates barcodes in Microsoft Reporting Services, without the use of barcode fonts. The designer and render DLLs provided are digitally signed and time-stamped with Authenticode certificates. Two separate installers for Reporting Services SQL Server 2005 and 2008, as well as, report example and...
Category: Business & Finance / Business Finance
Publisher: IDAutomation.com, Inc., License: Demo, Price: USD $1190.00, File Size: 4.4 MB
Platform: Windows
The QI Macros SPC Software for Excel draws pareto charts, control charts, histograms, box and whisker plots, Scatter plots and more. There are four "wizards" that figure out what Chart or statistic to draw based on your data. Better yet we do it right in Excel. Your just select your data and then select the Chart from the QI Macros menu. It also includes over 90...
Category: Business & Finance / MS Office Addons
Publisher: KnowWare International, Inc., License: Shareware, Price: USD $199.00, File Size: 12.7 MB
Platform: Windows
The Reporting Services Job Monitor (RSJM) allows you to monitor the status of long running reports in Microsoft Reporting Services or just see who is looking at what reports in real time.
Long running reports (anything more than about 10 mins) when executed as a snapshot either cause the Reporting Services front-end to time out, or to...
Category: Utilities / System Utilities
Publisher: Tom Morgan, License: Freeware, Price: USD $0.00, File Size: 476.5 KB
Platform: Windows

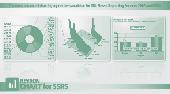
Nevron Data Visualization technology for Microsoft SQL Server Reporting Services is designed to deliver exceptional enhancements to your reports in both SSRS 2005 and SSRS 2008. It provides the needed flexibility and enterprise feature set, ensuring that your reports are making the visual statement that your data deserves. Literally all aspects of enterprise report authoring...
Category: Business & Finance / Database Management
Publisher: Nevron Software LLC, License: Shareware, Price: USD $1239.00, File Size: 182.2 MB
Platform: Windows

Likeoffice dll is written for developers of .Net or VB6 who work with Microsoft Reporting Services. The dll file allows you to easily export any report to the following format: pdf, xls, csv, tif, mhtml and xml without opening the Reporting Services. All you need to do is to add the dll to your project and point the reference to the dll.
Category: Business & Finance
Publisher: Likeoffice.com, License: Shareware, Price: USD $459.00, File Size: 296.9 KB
Platform: Windows

Aspose.Words for Reporting Services is a rendering extension for Microsoft SQL Server 2000, 2005 and 2008 Reporting Services as well as Microsoft report viewer. It allows you exporting RDL reports to flow layout documents and provides comprehensive support for exporting them to DOCX, DOC, HTML, MHTML, RTF, TXT, ODT, XML and WordML formats. All RDL report features...
Category: Business & Finance / Database Management
Publisher: Aspose Pty Ltd, License: Shareware, Price: USD $999.00, File Size: 14.9 MB
Platform: Windows
The Exolvo Reporting Services (ERS) module is a recognized, industry standard product which offers state-of-the-art, robust and powerful Reporting. ERS uses SQL Server Reporting Services (SSRS).
As ERS is a separate product, you have the ability to update and manage reports separately from the PayGlobal application. Report improvements and upgrades are...
Category: Business & Finance / Business Finance
Publisher: PayGlobal Ltd, License: Demo, Price: USD $0.00, File Size: 12.6 MB
Platform: Windows
User can paint individual lines by dragging the cursor over lines and identify data interactively.
User can paint individual lines by dragging the cursor over lines and identify data interactively.
In this version of Data Paint you have interactive Rotating Scatter Plot, Simple Scatter Plot, Bar Chart, Star Plot and Parallel Coordinate Plot.
This software can be customized for a specific need.
Category: Business & Finance / Business Finance
Publisher: Man Machine Interface, Inc, License: Freeware, Price: USD $0.00, File Size: 2.4 MB
Platform: Windows
DynaPlot is a real-time chart control for technical and scientific applications.
DynaPlot is a real-time Chart control for technical and scientific applications. Built-in tools such as autoscale, pan, scroll, stacked zoom, and cursors let the user examine the data quickly and easily. Features include line, bar, and Scatter plots; dynamic scaling of Chart elements with window extent; limit lines and tolerance masks with highlighted tolerance violations...
Category: Software Development / Tools & Editors
Publisher: Wilhelm Kurz, License: Shareware, Price: USD $240.00, File Size: 2.4 MB
Platform: Windows
Shareware
Nevron Chart for .NET is designed to be flexible, efficient and extensible. Combining a vast amount of features in an intuitive and straightforward programming model, the component can display virtually any 2D or 3D Chart including: Bar, Line, Step Line, Area, Pie, Point, Bubble, Stock, Floating Bar, Radar, Polar, High Low, Mesh Surface, Grid Surface, Shape, Smooth Line, Float...
Category: Software Development / Components & Libraries
Publisher: Nevron Software LLC, License: Shareware, Price: USD $589.00, File Size: 245.0 MB
Platform: Windows
Nevron Chart for .NET is designed to be extensible, efficient and feature rich. It wraps a vast amount of features in an intuitive and straightforward programming model. The component can display virtually any 2D or 3D Chart including: Bar, Line, Step Line, Area, Pie, Point, Bubble, Stock, Floating Bar, Radar, Polar, High Low, Mesh Surface, Grid Surface, Shape, Smooth Line, Float...
Category: Software Development / Components & Libraries
Publisher: Nevron Software, License: Shareware, Price: USD $589.00, File Size: 156.2 MB
Platform: Windows
The current Chart for .NET version offers a great generic Charting control for a myriad of charting requirements, targeting too, important vertical areas such as the financial, scientific and statistical worlds. This data visualization component fits to environment needs such as WPF, Silverlight, Flash, ASP.NET, Winform, SQL Reporting Services, Compact Framework and Windows...
Category: Business & Finance / Business Finance
Publisher: Steema Software, License: Shareware, Price: USD $759.00, File Size: 151.3 MB
Platform: Windows
DynaPlot is a real-time chart control for technical and scientific applications.
DynaPlot is a real-time Chart control for technical and scientific applications. Built-in tools such as autoscale, pan, scroll, stacked zoom, and cursors let the user examine the data quickly and easily. Features include line, bar, and Scatter plots; dynamic scaling of Chart elements with window extent; limit lines and tolerance masks with highlighted tolerance violations...
Category: Software Development / ActiveX
Publisher: Wilhelm Kurz, License: Shareware, Price: USD $0.00, File Size: 2.0 MB
Platform: Windows
Shareware
Nevron Gauge for SQL Server Reporting Services (SSRS) 2005/2008 is an advanced report item, which delivers a complete set of gauge types, highly customizable axes, tight data integration and unmatched visual effects to your reports. It will also improve your authoring experience, with its polished visual editors, refined settings and well organized structure. Nevron Gauge for SSRS...
Category: Business & Finance / Database Management
Publisher: Nevron Software LLC, License: Shareware, Price: USD $589.00, File Size: 145.0 MB
Platform: Windows
AnyChart is a robust and superfast JavaScript charting library to add great-looking, interactive HTML5 charts into any project, in any browser, and on any platform/OS including mobile ones. AnyChart provides advanced customization and flexibility opportunities, no matter if you are developing a website, a business intelligence application (BI) for corporate usage, or some software for your...
Category: Web Authoring / JavaScript
Publisher: AnyChart JavaScript Charts, License: Shareware, Price: USD $49.00, File Size: 17.8 MB
Platform: Windows, Mac, Linux,
The RTU-310 IP Services Test Head is a powerful 24/7 network testing solution for IPTV and Ethernet Services.
Main features:
- High-performance probe hardware supporting hundreds of simultaneous Services
- Real-time measurement of over 35 IPTV metrics
- Detailed Ethernet statistics and error Reporting
- Alarm...
Category: Audio / Rippers & Encoders
Publisher: EXFO Electro-Optical Engineering inc, License: Freeware, Price: USD $0.00, File Size: 161.7 MB
Platform: Windows
This product creates barcodes in Microsoft Reporting Services as an integrated drag-and-drop Custom Report Item (CRI) control, without the use of barcode fonts. The designer and render DLLs provided are digitally signed and time-stamped with Authenticode certificates. The Barcode CRI license is perpetual and royalty free. Includes report example and integration tutorial. Supports...
Category: Business & Finance / Inventory Systems
Publisher: IDAutomation.com, Inc., License: Demo, Price: USD $395.00, File Size: 727.0 KB
Platform: Windows