Free Downloads: Graph Plots
License: All | Free
Graph Extract is a program for digitizing plots.
Graph Extract is a program for digitizing Plots. Using either manual or automated approaches, this program provides a means to easily extract numeric data from Plots. The resulting X-Y data can be printed or replotted, or it can be saved in Excel file for
Category: Multimedia & Design
Publisher: quadtechassociates.com, License: Freeware, Price: USD $0.00, File Size: 446.0 KB
Platform: Windows
This free program Plots in realtime all data sent and received using the Dial-Up Networking Adapter and Modem. Shows separate sent, received, send rate, received rate, peaks and totals. Five graphs and statistics. Animated System Tray Icon. Allows you to change colours, Graph size, sample seconds, 3D Graph, axis and more. Full automated self-upgrade. Autostart with...
Category: Internet / Dial-up & Connectivity
Publisher: Ashok Kumar Parmar, License: Freeware, Price: USD $0.00, File Size: 819.2 KB
Platform: Windows
Plot Digitizer is a great piece of software developed by Joseph A.
Plot Digitizer is a great piece of software developed by Joseph A. Huwaldt. The main goal of the program is to extract information from two-dimensional Plots or graphs. It is very common to find information the form of a plot or Graph, showing the relation between two variables. However, this information will not be useful until data is converted to standard x-y values (table...
Category: Multimedia & Design / Multimedia App's
Publisher: Joseph A. Huwaldt, License: Freeware, Price: USD $0.00, File Size: 4.4 MB
Platform: Windows
JFreeChart is a free Java class library for generating charts (GNU LGPL). Support is included for: pie charts, bar charts, line charts, scatter Plots, time series charts, candlestick charts, high-low-open-close charts and more. Use in applications, servlets, JSP or applets. Export to PNG, JPEG, PDF, SVG and HTML image maps. Complete source code is included, subject to the GNU LGPL.
Category: Software Development
Publisher: Object Refinery Limited, License: Freeware, Price: USD $0.00, File Size: 5.3 MB
Platform: Windows, Linux, Unix
Graph Studio is the open source graph drawing/processing software.
Graph Studio is the open source Graph drawing/processing software. It allows users to build and process highly customizable graphs.
Category: Multimedia & Design
Publisher: sourceforge.net, License: Freeware, Price: USD $0.00, File Size: 118.0 KB
Platform: Windows, Mac, Vista
Graph constructs, visualizes and modifies graphs as well as calculates measures and layouts.
Graph constructs, visualizes and modifies graphs as well as calculates measures and layouts.
CoSBiLab Graph can construct, visualize and modify graphs as well as calculate measures and layouts. CoSBiLab Graph can import and export data in a variety of formats, among which the reaction network generated by the beta WorkBench.
Category: Multimedia & Design / Multimedia App's
Publisher: CoSBi, License: Freeware, Price: USD $0.00, File Size: 3.1 MB
Platform: Windows
DataPlot is a program where you can import your time based data and graph it.
DataPlot is a program where you can import your time based data and Graph it.You can move easily back and forward in user defined time window, allows individual time setting for each Graph, values read directly in Graph by dragging mouse over the curve and much more
Category: Multimedia & Design / Multimedia App's
Publisher: CBIM, License: Freeware, Price: USD $0.00, File Size: 311.0 KB
Platform: Windows
Drawing graphs without the right tool is simply difficult.
Drawing graphs without the right tool is simply difficult. uDraw(Graph) automates this task for you. Find out how uDraw(Graph) creates your flow charts, diagrams, hierarchies or structure visualizations using automatic layout - much faster than with any standard drawing program. With the API, uDraw(Graph) can even be embedded in your own programs as a visualization component.
Category: Multimedia & Design / Image Editing
Publisher: University Bremen, FB3, Germany, License: Freeware, Price: USD $0.00, File Size: 2.6 MB
Platform: Windows
DatPlot is a free data visualization application that was developed to easily and quickly create strip chart Plots from delimited text files, such as CSV or similar files. Data can be plotted using line or scatter Plots, events can be marked and parameter values at the event lines are automatically labeled. Finally, by swapping source data files, multiple Plots of similar...
Category: Utilities / Misc. Utilities
Publisher: Aeroperf, License: Freeware, Price: USD $0.00, File Size: 1.2 MB
Platform: Windows
The WebViewer plug-in enables Windows users whether or not they have SigmaPlot to explore the data used to create the Graph.
Using the WebViewer plug-in with your Web browser window you can:
- View the data used to create the Graph
- Print a Graph in a web document at full resolution
- Zoom in and out of a Graph
- Grab and...
Category: Multimedia & Design / Graphics Viewers
Publisher: SYSTAT Software Inc., License: Freeware, Price: USD $0.00, File Size: 12.6 MB
Platform: Windows
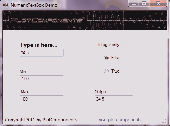
With The Option Strategy Builder you could pick up an option and place it directly to the return Graph. As with the online tool, just drag and drop the option on the Graph, and build your strategy. Using your mouse, the options can be easily moved on the Graph to different strike prices, and to different expiration dates.
With this program you can manage your...
Category: Multimedia & Design / Multimedia App's
Publisher: SamoaSky, License: Freeware, Price: USD $0.00, File Size: 3.1 MB
Platform: Windows
STRUPLO for Windows is a MS-Windows version of STRUVIR, a program for producing polyhedra Plots for Inorganic crystal structures. It incorporates a Graphical User Interface (GUI) to make production of these Plots much easier. Most of the commonly used features of STRUVIR are directly available from the GUI. The interface is similar to that of Ortep-3 for Windows, and loading a...
Category: Home & Education / Science
Publisher: Louis J. Farrugia, License: Freeware, Price: USD $0.00, File Size: 1.4 MB
Platform: Windows

Archim is a program for drawing the graphs of all kinds of functions. You can define a Graph explicitly and parametrically, in polar and spherical coordinates, on a plane and in space (surface). Archim will be useful for teachers and students, as well as for everyone who is interested min geometry. With Archim, you will draw the Graph of any function and form, just use your...
Category: Home & Education
Publisher: Stochastic Lab, License: Freeware, Price: USD $0.00, File Size: 479.6 KB
Platform: Windows
Graph-A-Ping allows you to visually see the ping latency between ping times.
Graph-A-Ping allows you to visually see the ping latency between ping times. The bigger the gap between one ping to another allows you to spot possible network bottle neck.
This tool is actually an applet part of Glass Net Networks monitoring console.
Category: Internet / Misc. Plugins
Publisher: Mataluis.Com, License: Freeware, Price: USD $0.00, File Size: 2.1 MB
Platform: Windows
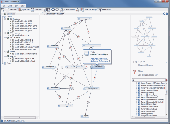
CentiBiN is an application for the calculation and visualization of centralities for biological networks.
Features:
- Computing different vertex and Graph centrality measures
- Visualize a network and the computed centralities with five different layout algorithms
- Display distribution Plots and histograms for computed centralities
- Reading and...
Category: Internet / Misc. Plugins
Publisher: Dirk Koschuetzki, IPK Gatersleben, Germany, License: Freeware, Price: USD $0.00, File Size: 4.8 MB
Platform: Windows
Graph visualization is a way of representing structural information as diagrams of abstract graphs and networks. Automatic Graph drawing has many important applications in software engineering, database and web design, networking, and in visual interfaces
Category: Multimedia & Design
Publisher: graphviz.org, License: Freeware, Price: USD $0.00, File Size: 26.6 MB
Platform: Windows, Mac, Vista
The NetGraph – network monitor 2.
The NetGraph – network monitor 2.0 is a software network-monitoring program that enables users to see at a glance the activities on their networks including the volumes of traffic with four simple Graph mode indicators.
The program works on any Windows’ network connection and NetGraph – network monitor 2.0’s four modes include 2 snapshot modes and 2...
Category: Internet / Monitoring
Publisher: Nikola Dachev, License: Freeware, Price: USD $0.00, File Size: 0
Platform: Windows
MathTrax is a graphing tool for middle school and high school students to Graph equations, physics simulations or plot data files.
The graphs have descriptions and sound so you can hear and read about the Graph. Blind and low vision users can access visual math data and Graph or experiment with equations and datasets.
Category: Business & Finance / Applications
Publisher: The MathTrax Team, License: Freeware, Price: USD $0.00, File Size: 21.0 MB
Platform: Windows
System in which the player chooses plots of land to organize various locations within the game.
System in which the player chooses Plots of land to organize various locations within the game. By defeating enemies in battle, the player can collect experience point crystals that spill out.
The main character can equip a variety of weapons, armors, and accessories. Weapons grant the player the ability to perform abilities in combat.
Category: Games / Action
Publisher: Softendo, License: Freeware, Price: USD $0.00, File Size: 11.8 MB
Platform: Windows
 Freeware
African Plots screensaver will be loved by people who want to enjoy exotic countries and african safari. Every scene in the screensaver shows various moments of animals life. Proud lion rules other animals as king. You will find giraffes, elephants, rhinos, hippopotamus, snakes, turtle, butterflies and other inhabitants. So there is no need to go to far places, enjoy splendid animated...
Category: Desktop Enhancements / Screensavers
Publisher: FullScreensavers.com, License: Freeware, Price: USD $0.00, File Size: 5.4 MB
Platform: Windows
PlotPad is a .net component that provides a visual control to visualize data in cartesian Plots. Developers of WinForms applications can easily create xy-, yt- or scope-Plots by simply feeding the component with their data. PlotPad has a lot of powerful functions and allows developers to concentrate on their main task. Built-in dialogs, clipboard support, context menu, toolbar and...
Category: Software Development / Components & Libraries
Publisher: PlotComponents e.K., License: Freeware, Price: USD $0.00, File Size: 3.0 KB
Platform: Windows
RJS Graph produces professional scientific and mathematical graphs.
RJS Graph produces professional scientific and mathematical graphs. You may study the data with a wide range of data analysis tools. Features include the ability to plot data and equations, fit best fit curves and splines, and display fitted best fit curve parameters. Data can be pasted from a spreadsheet or imported from a text file using a wizard.
Category: Home & Education / Mathematics
Publisher: RJS, License: Freeware, Price: USD $0.00, File Size: 3.7 MB
Platform: Windows
T&D Graph has been designed as a user friendly software which brings users even more effective tools for the management and analysis of data recorded by T&D Data Loggers. It contains a variety of useful functions including the ability to read and merge multiple data files and display recorded data in Graph and/or list form.
Category: Software Development / Misc. Programming
Publisher: T&D CORPORATION, License: Freeware, Price: USD $0.00, File Size: 11.3 MB
Platform: Windows
For viewing data plots downloaded from the M-2001C using TapTalk.
For viewing data Plots downloaded from the M-2001C using TapTalk.TapPlot is a windows based program for viewing the data that has been retrieved using the Data Logging feature of TapTalk. The program is free to use and install on all major windows operating systems.
Category: Business & Finance / Business Finance
Publisher: Beckwith Electric CO. INC., License: Freeware, Price: USD $0.00, File Size: 4.3 MB
Platform: Windows
Draws a detail of wall or roof sections, calculates U-value, Time Lag, and Decrement Factor.
Draws a detail of wall or roof sections, calculates U-value, Time Lag, and Decrement Factor. It Plots temperature drop through the section. Draws 2-D daily and 3-D annual Plots of Outdoor and Sol-Air Temperatures, Normal and Total Surface Radiation, and Heat Flow through the envelope.
It was originally called SOLAR-3.
Category: Multimedia & Design / Digital Media Editors
Publisher: UCLA Dept. of Architecture and Urban Design, License: Freeware, Price: USD $0.00, File Size: 807.8 KB
Platform: Windows
Function Analyzer is a program that draws the Graph of a function with one variable declared by the user. The operators used to build the mathematical expression are the usual ones used in software calculators: * for multiplying, / for dividing, ^ for power and so on. Parentheses can be used to group terms in your expression. Trigonometric functions are also supported, along with a few...
Category: Home & Education / Mathematics
Publisher: Lorenzi Davide, License: Freeware, Price: USD $0.00, File Size: 1.3 MB
Platform: Windows
JGraph is the leading Open Source Java Graph Visualization Library.
JGraph is the leading Open Source Java Graph Visualization Library. It follows Swing design patterns to provide an API familiar to Swing programmers and functionality that provides a range of features. Graph visualization is a central requirement for applications such as workflow editors, computer and telecommunication networks display, flowcharts, VLSI and CAD, business process...
Category: Software Development / Components & Libraries
Publisher: JGraph Ltd, License: Freeware, Price: USD $0.00, File Size: 136.0 KB
Platform: Windows, Linux, Mac
This program analyzes network traces of Transmission Control Protocol (TCP) connections.
This program analyzes network traces of Transmission Control Protocol (TCP) connections. Given a Microsoft Network Monitor trace, the analyzer provides various performance statistics and visualizations for the captured TCP connection. Included are Plots of the time-sequence Graph, round-trip time measurements, and more.
The tool also contains an analysis engine that...
Category: Internet / Monitoring
Publisher: Microsoft Research, License: Freeware, Price: USD $0.00, File Size: 530.5 KB
Platform: Windows

Obtain data from images of graphs scanned from articles or available as image. Import the Graph into ScanIt from a scanner or file, or from the clipboard. Define locations of the Graph's axes by indicating known points. Extract data from the Graph by manually picking points, by scanning for points or by scanning along curves. Copy the scanned data to Excel or export data to...
Category: Home & Education / Science
Publisher: amsterchem, License: Freeware, Price: USD $0.00, File Size: 6.1 MB
Platform: Windows
Christmas Plots Screensaver is another seasonal screensaver from FullScreensavers.
Christmas Plots Screensaver is another seasonal screensaver from FullScreensavers.com. It offers three nice scenes, all with a Christmas tree. Moreover, you will see a winter yard, pets, lit candles, a fireplace, and Santa Claus riding in sledge with deer, and a nice clock in the form of a Christmas tree toy. Also, you will hear lovable Christmas melodies (it's a pity you can not...
Category: Desktop Enhancements / Screensavers
Publisher: FullScreensavers.com, License: Freeware, Price: USD $0.00, File Size: 3.7 MB
Platform: Windows
RPluto - Graphical Display of Molecular and Crystal Structures.
RPluto - Graphical Display of Molecular and Crystal Structures.
Main features:
- A range of input file formats (CSD FDAT, SHELX and CIF formats)
- Data typed in free-format style (i.e. from file or keyboard), which may be useful for comparing current work with examples from the CSD
- Display of both molecular and packing diagrams
- Intra- and...
Category: Home & Education / Science
Publisher: CCDC, License: Freeware, Price: USD $0.00, File Size: 2.5 MB
Platform: Windows
Freeware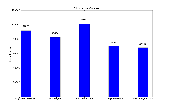
Free Graph Generator is a simple bar chart generation tool that lets you create custom bar charts of any size. Edit bar color, bar width, bar title, and bar side label properties.
Category: Home & Education / Mathematics
Publisher: Innovative Creations Software, License: Freeware, Price: USD $0.00, File Size: 16.5 MB
Platform: Windows
gbPlot provides colorful plots of 3D surface equations.
gbPlot provides colorful Plots of 3D surface equations. Features include pre-loaded equations, retreival of equations from an online database of over 75,000,000 equations, solid, wireframe, and point image formats.
Images may be saved to file or copied to the clipboard.
Online updates are supported.
gbPlot allows the user to create a 3D plot using equations of...
Category: Business & Finance / Applications
Publisher: Gary Beene's Information Centers, License: Freeware, Price: USD $0.00, File Size: 3.4 MB
Platform: Windows
ninithi 3D modelling software can be used to visualize carbon nanotubes, fullerene, graphene and carbon nanoribbons and analyse their band structure Plots. The software also provides 3-D views of the molecular structures of those molecules and graphs illustrating electrical properties of them.
Category: Multimedia & Design / Image Editing
Publisher: Lanka Software Foundation, License: Freeware, Price: USD $0.00, File Size: 0
Platform: Windows
WAFERMAP is an award winning software package used to collect, edit, analyze and visualize measured physical parameters on semiconductor wafers. WAFERMAP can import data files from various metrology tools such as ellipsometers, thickness gauges and four point probes. The imported data can then be visualized or printed as line scans, contour Plots, 2D or 3D Plots or as a histogram.
Category: Multimedia & Design / Media Management
Publisher: Boin GmbH, License: Freeware, Price: USD $0.00, File Size: 7.2 MB
Platform: Windows
Biorhytm is a small application that generates your biorhytm status.
Biorhytm is a small application that generates your biorhytm status.
Enter your birthday and a Graph will reveal your
bio health, with charts and lines displaying your physical, intellectual and emotional state as well. You can save result Graph to BMP file.
Category: Home & Education / Astrology & Numerology
Publisher: aOlej, License: Freeware, Price: USD $0.00, File Size: 389.0 KB
Platform: Windows
iTraffic Monitor is a network monitor and reporting tool.
iTraffic Monitor is a network monitor and reporting tool. It provides real time Graph of network traffic. Detailed stats provide daily/weekly/monthly/yearly stats.
Main features:
- Monitor and review your Internet or network bandwidth usage with ease.
- How fast your internet connection? We can Graph it for your review.
- How much data do yo u...
Category: Internet / Monitoring
Publisher: Charles DeWeese, License: Freeware, Price: USD $0.00, File Size: 1.1 MB
Platform: Windows
PeCo-Graph is the software for the procurement and graphical visualisation of the counting data from one or multiple PeCo range units. An easy-to-use application for PC that eases the download of the counting data and simplifies their analysis and graphical representation.
It has multiple charts to easily make presentations, for instance, with comparisons of the data acquired in...
Category: Business & Finance / Business Finance
Publisher: Visual Tools S.A., License: Freeware, Price: USD $0.00, File Size: 3.3 MB
Platform: Windows
The Library GraphDiag is intended for building Graph and diagrams on HBITMAP, surface DirectDraw and in file BMP format. The Library can build the graphs on entered text line and diagrams, as from tables, which format is provided by developer, so and from files HTML-format and from XLS files Excel. Given version first and is not deprived defect and restrictions. The Restrictions are of...
Category: Software Development / Components & Libraries
Publisher: Kruchinin Aleksandr, License: Freeware, Price: USD $0.00, File Size: 67.0 KB
Platform: Windows
Atlantis Schema Surf is our SQL dependency & live entity ER diagram tool - it is a free animated graphing tool which allows you to easily visualize the dependencies between the objects in your SQL Server databases in a live entity ER diagram.
Schema Surf, like it's counterpart Data Surf, contains a "Surf Graph" which allows you to easily view an object and the...
Category: Business & Finance / Database Management
Publisher: Atlantis Interactive UK Ltd., License: Freeware, Price: USD $0.00, File Size: 7.4 MB
Platform: Windows
WTides is a free program that uses harmonics data to predict tide heights at many locations throughout the World, and displays a Graph of the results according to the time zone of the target location. The tide Graph can be overlaid with a solunar chart to give an interesting version of the Maori Fishing Calendar. The program runs on any version of Microsoft Windows from Windows 95.
Category: Multimedia & Design / Digital Media Editors
Publisher: Managing Data Resources (NZ) Ltd, License: Freeware, Price: USD $0.00, File Size: 601.9 KB
Platform: Windows
This program plots a spectral diagram of the phase space of a dynamical system generated by a one dimensional piecewise linear map with 2(3) full single-valued branches of interval [0,1] onto itself.
Category: Home & Education / Miscellaneous
Publisher: advmathappl.com, License: Freeware, Price: USD $0.00, File Size: 232.0 KB
Platform: Windows, Mac
GraphSight Junior is an easy to use freeware handy 2D math-graphing program.
GraphSight Junior is an easy to use freeware handy 2D math-graphing program. It was originally designed to help students and teachers satisfy their day-after-day math plotting needs. It makes it easy to plot and explore common Y(X) = F(X) Cartesian graphs, set text labels on the coordinate plane, zoom or shift a Graph with just a single click & move of mouse. The resulting picture...
Category: Home & Education / Miscellaneous
Publisher: CradleFields.com, License: Freeware, Price: USD $0.00, File Size: 393.0 KB
Platform: Windows
AprsPlotter decodes and Plots position reports found in APRS messages
AprsPlotter provides an OLE/COM (Automation) output that gives the current position of each station whose data has been received. CombiPlotter from COAA uses the OLE/COM output and allows you to display the APRS data together with aircraft decoded by PlanePlotter, ships decoded by ShipPlotter as well as...
Category: Utilities / Misc. Utilities
Publisher: COAA, License: Freeware, Price: USD $0.00, File Size: 597.9 KB
Platform: Windows
If you are searching for a computer program that can plot simple graphs on your PC, GraphSight Junior is what you are looking for. This utility is feature rich and comprehensive. It Plots 2D graphs with easy navigation, and it’s well suited for high school and college math students.
It can plot Cartesian, polar, table defined, as well as specialty graphs, such as...
Category: Home & Education / Mathematics
Publisher: CradleFields.com, License: Freeware, Price: USD $0.00, File Size: 417.5 KB
Platform: Windows
Orbital Viewer can display almost any atomic or molecular electron probability function.
Orbital Viewer can display almost any atomic or molecular electron probability function. For atoms, this plotted function is the hydrogenic solution of Schrodinger's Equation. For molecules, the linear combination of atomic orbitals (LCAO) method is used.
There are three broad categories of what can be displayed: surfaces of constant probability, probability distributions, and...
Category: Multimedia & Design / Graphics Viewers
Publisher: David Manthey, License: Freeware, Price: USD $0.00, File Size: 586.3 KB
Platform: Windows

Install this screensaver on your PC and dive into the unique charm of Christmas and New Year holidays. You will find Christmas candles in the frame of the Christmas tinsel, gifts on the window, snowman, snow drifts, and the Christmas tree with toys. Christmas yard, pets, birds, enjoying the holidays, and Santa Claus flying across the sky in a sleigh full of gifts. Tree with New Year attributes...
Category: Desktop Enhancements / Screensavers
Publisher: FullScreensavers.com, License: Freeware, Price: USD $0.00, File Size: 7.0 MB
Platform: Windows
GraphTablet is a handy application to create blank graph paper.
GraphTablet is a handy application to create blank Graph paper. It doesn’t have any help file, but it is very easy to use and can be helpful for students, pupils and even for preschool age kids as a graphic coloring paper.
GraphTablet offers you a clear interface and has only one window. It consists of the “Preview” window on the right and all controls and...
Category: Multimedia & Design / Multimedia App's
Publisher: Michael Eve, License: Freeware, Price: USD $0.00, File Size: 272.9 KB
Platform: Windows
XYGraph is a native . NET charting component showing data in a cartesian graph (X,Y).
Controls from componentXtra gives royalty free software integration. Both the free and purchased products includes sample code (VB and C#). .
Category: Software Development
Publisher: componentXtra, License: Freeware, Price: USD $0.00, File Size: 390.6 KB
Platform: Windows
Freeware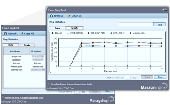
The ManageEngine FREE Ping tool is a simple yet powerful tool with an elegant UI that helps to issue ping requests to "Multiple IP Addresses" in a single instance. And can find the health of the sever continuously for a maximum of 10 hosts. The ping data such as Ipaddress, RoundTripTime, Time To Live (Ttl), Buffer Size and the status are shown in a table. The ManageEngine Free ping tool gives...
Category: Internet / Tools & Utilities
Publisher: ZOHO Corporation, License: Freeware, Price: USD $0.00, File Size: 1.5 MB
Platform: Windows