Free Downloads: Graph Chart In Pocket
The 2D / 3D Line Graph provides both a client and server side solution for the incorporation of line graphs and charts into web pages. It provides versatile components so that web authors and Java developers can easily build and publish dynamic and interactive line charts. Both the applet and servlet are designed to take multiple series of numerical data and Graph the information...
Category: Internet
Publisher: Sirius Computer Consultants Limited, License: Shareware, Price: USD $49.00, File Size: 384.2 KB
Platform: Windows, Linux, OS/2, Mac, Unix, MS-DOS
 Shareware
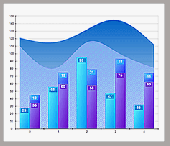
Nevron Chart for .NET is designed to be flexible, efficient and extensible. Combining a vast amount of features in an intuitive and straightforward programming model, the component can display virtually any 2D or 3D Chart including: Bar, Line, Step Line, Area, Pie, Point, Bubble, Stock, Floating Bar, Radar, Polar, High Low, Mesh Surface, Grid Surface, Shape, Smooth Line, Float...
Category: Software Development / Components & Libraries
Publisher: Nevron Software LLC, License: Shareware, Price: USD $589.00, File Size: 245.0 MB
Platform: Windows
TeeChart ActiveX includes 60+ Chart types in 2D, 3D to visualize data. From the common Line, Bar, Area, Pie Chart to the field-specific charts like Candle OHLC, Point and Figure, Volume, High-Low,BoxPlot,etc It provides a large selection Financial and Statistical Indicators that perform calculations ranging from basic mean; Mode Function, Median Function to the more complex...
Category: Software Development / Components & Libraries
Publisher: Steema Software, License: Shareware, Price: USD $469.00, File Size: 52.3 MB
Platform: Windows
Visual loan analyzer is an easy to use loan and mortgage analyzer.
Visual loan analyzer is an easy to use loan and mortgage analyzer. Simply select any three out of the four variables and the missing one is calculated. An amortization table is created along with a Chart of interest vs capital and a Graph showing the interest and capital constituents of the repayment over time. You can compare up to 7 different results using the buttons at the...
Category: Business & Finance / Calculators
Publisher: loan-base.com, License: Shareware, Price: USD $14.95, File Size: 675.8 KB
Platform:
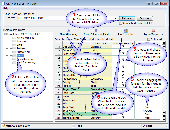
AddFlow is an ActiveX control that lets you quickly build flowchart-enabled applications. Features such as distinct colors, fonts, shapes, styles, pictures, text, and so on for each object of the diagram (node or link) are available. Nodes stay connected when moved. Metafiles support, serialization, multi-level undo/redo, printing, zooming, Bezier and spline curves, reflexive links, link jumps,...
Category: Software Development
Publisher: Lassalle Technologies, License: Commercial, Price: USD $499.00, File Size: 3.6 MB
Platform: Windows
SBHistogram generates simple histograms from simple ASCII data files.
SBHistogram generates simple histograms from simple ASCII data files. It's a simple tool designed to be easy to use.
A histogram is a Chart in which data values in counted and placed into buckets. For example, let's assume you want to do a histogram of peoples ages. Then you might want to use buckets such as 1-10 years, 11-20 years, 21-30 years, etc. Each bucket counts...
Category: Multimedia & Design / Multimedia App's
Publisher: SB-Software, License: Freeware, Price: USD $0.00, File Size: 604.0 KB
Platform: Windows
Graph Studio is the open source graph drawing/processing software.
Graph Studio is the open source Graph drawing/processing software. It allows users to build and process highly customizable graphs.
Category: Multimedia & Design
Publisher: sourceforge.net, License: Freeware, Price: USD $0.00, File Size: 118.0 KB
Platform: Windows, Mac, Vista
PeCo-Graph is the software for the procurement and graphical visualisation of the counting data from one or multiple PeCo range units. An easy-to-use application for PC that eases the download of the counting data and simplifies their analysis and graphical representation.
It has multiple charts to easily make presentations, for instance, with comparisons of the data acquired in...
Category: Business & Finance / Business Finance
Publisher: Visual Tools S.A., License: Freeware, Price: USD $0.00, File Size: 3.3 MB
Platform: Windows
Demo
Imagine a complete Graphing solution assisting you right from importing data and manipulating data, plotting graphs, customizing looks, saving and exporting your graphs as high quality images and producing dynamic reports of your data in a matter of a few easy steps. Features: Data Import: Connects effortlessly with your MS SQL Server, Oracle, Access, XLS and CSV files and additionally...
Category: Software Development / Databases & Networks
Publisher: Teknowledge LLC, License: Demo, Price: USD $99.00, File Size: 8.1 MB
Platform: Windows
PPT to Pocket PC Trial . Convert PowerPoint Presentation to Pocket PC video
WithPPT to Pocket PC you can convert your PowerPoint presentations to WMV compatible with Pocket PC for viewing PowerPoint files on Pocket PC anywhere, anytime at your convenience.
Category: Multimedia & Design / Media Management
Publisher: Wondershare Software Co., Ltd., License: Shareware, Price: USD $0.00, File Size: 9.4 MB
Platform: Windows
Shareware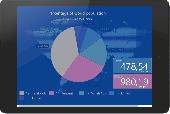
Feature Summary: -Default support for Android v2.1 multi-touch versions and greater (small change for earlier versions) -50 Chart styles (in 2D and 3D plus multiple combinations) including Gauges -38 mathematical functions -100% sourcecode available as purchase option -20 Chart Tool components for additional functionality, like dragging series marks, annotation objects,...
Category: Software Development / Components & Libraries
Publisher: Steema Software, License: Shareware, Price: USD $259.00, File Size: 10.7 MB
Platform: Windows
Chart Trainer -Learn to read nautical charts like an expert.
Chart Trainer -Learn to read nautical charts like an expert.
Chart Trainer is designed to help mariners interpret nautical charts and use them more efficiently, both traditional paper charts and new digital charts for computers. The materials cover all aspects of nautical charts in the most detail available, including tutorials on Chart reading and plotting, along...
Category: Home & Education / Teaching Tools
Publisher: Starpath School of Navigation, License: Shareware, Price: USD $39.00, File Size: 39.8 MB
Platform: Windows
This applet is designed to take multiple series of numerical data and display the information as a 3D Multi series stacked Column Chart. The applet will automatically size itself to the available area given to it by the HTML form. (The WIDTH and HEIGHT of the APPLET tag.) General Features 3D ModeChart Grids On/Off Color SelectableChart Axis On/Off Color SelectableOutlines On/Off Color...
Category: Internet / Tools & Utilities
Publisher: Sirius Computer Consultants Limited, License: Demo, Price: USD $30.00, File Size: 58.0 KB
Platform: Windows
KG-Chart for Cross Stitch" is a program to design a chart for cross stitching.
KG-Chart for Cross Stitch" is a program to design a Chart for cross stitching.
The ability to draw each stitch with a color and mark makes it easier for users to create a pattern for cross stitching. Usual painting software can't do this.
With this program you can print a Chart and a color table in which pages are automatically divided.
It also...
Category: Software Development / Help File Utilities
Publisher: Mozusystems, LLC, License: Shareware, Price: USD $0.00, File Size: 1.2 MB
Platform: Windows
KG-Chart for Cross Stitch" is a program to design a chart for cross stitching.
KG-Chart for Cross Stitch" is a program to design a Chart for cross stitching. This program has following features:
* Drawing pixels with mark to distinguish color.
* Color palette (mimic DMC's thread color).
* Drawing backstitching
* Print/Preview/Real view of a Chart.
* Import/Export a Chart to/from other image...
Category: Multimedia & Design / Multimedia App's
Publisher: Keiji Ikuta Software Laboratory, License: Freeware, Price: USD $0.00, File Size: 1.1 MB
Platform: Windows
Graph constructs, visualizes and modifies graphs as well as calculates measures and layouts.
Graph constructs, visualizes and modifies graphs as well as calculates measures and layouts.
CoSBiLab Graph can construct, visualize and modify graphs as well as calculate measures and layouts. CoSBiLab Graph can import and export data in a variety of formats, among which the reaction network generated by the beta WorkBench.
Category: Multimedia & Design / Multimedia App's
Publisher: CoSBi, License: Freeware, Price: USD $0.00, File Size: 3.1 MB
Platform: Windows
WTides is a free program that uses harmonics data to predict tide heights at many locations throughout the World, and displays a Graph of the results according to the time zone of the target location. The tide Graph can be overlaid with a solunar Chart to give an interesting version of the Maori Fishing Calendar. The program runs on any version of Microsoft Windows from...
Category: Multimedia & Design / Digital Media Editors
Publisher: Managing Data Resources (NZ) Ltd, License: Freeware, Price: USD $0.00, File Size: 601.9 KB
Platform: Windows
This program will enable you to display data in the colored 3D chart.
This program will enable you to display data in the colored 3D Chart. The program uses the 3D graphics library to display data in the 3D Chart.
Main Features
- Easy import of data from the TXT file.
- Fast 3D graphics.
- Colored scale.
- All properties of the Chart can be edited.
- Increasing data density using a filter...
Category: Multimedia & Design / Image Editing
Publisher: Michal Pohanka, License: Freeware, Price: USD $0.00, File Size: 1.4 MB
Platform: Windows
The Chart! is a software developed by DescriptMED that offers you an easy access to the charts of your patient when you don't have access to the daily Chart of the patient. This software allows doctors to gain very valuable time and to get the proper information very fast , no matter where they when they are searched
Category: Business & Finance / Business Finance
Publisher: DescriptMED, LLC, License: Shareware, Price: USD $2500.00, File Size: 35.9 MB
Platform: Windows
KaotiXL is an add in use to do a rescaled range analysis with MS Excel.
KaotiXL is an add in use to do a rescaled range analysis with MS Excel. User will learn how easy it is to use a worksheet as a powerful forecasting tool. It also generate a report with all the calculated values shown and 2 Graph are built. The R/S Chart and V statistic Chart. Hurst exponent is also calculated and shown in this report. Charting in this program will make it...
Category: Business & Finance / Personal Finance
Publisher: XLPert Enterprise, License: Shareware, Price: USD $15.00, File Size: 85.0 KB
Platform: Windows
Stock Quotes for Pocket PC is an easy-to-use application for modern mobile platform. It allows you to monitor stock quotes information provided by Yahoo in real time. Besides, you can view news relevant to the selected stock, set customizable alerts, search for ticker and get company summary information by its stock symbol. Stock Quotes for Pocket PC consists of 4 main views:...
Category: Business & Finance
Publisher: OLSOFT, License: Shareware, Price: USD $9.95, File Size: 3.2 MB
Platform:
OLAP Statistics & Reporting for SharePoint enables you to connect to a SharePoint list, task or calendar and explore data in a multi-dimensional grid, pivot tables, filters, and Graph or Chart view. You can run this OLAP analysis tool on on each SharePoint list, with its own unique set of fields. You can specify any field as the measure using functions such as sum, count,...
Category: Business & Finance / Applications
Publisher: AssistMyTeam, License: Shareware, Price: USD $75.00, File Size: 5.6 MB
Platform: Windows
The software allows to choose selective range of the Chart and it draws the standard Chart with predefined set of lines or blank Chart. The Chart can be drawn for any atmospheric pressure in a very wide range. It also allows user to draw any relative humidity line, wet bulb line, specific volume line and specific enthalpy line feasible within the selected range.
Category: Software Development / Misc. Programming
Publisher: psychrosoft, License: Shareware, Price: USD $20.00, File Size: 2.2 MB
Platform: Windows
Chart FX for Java Server has rich functionality that takes full advantage of the Java platform, and comes in 2 versions: Chart FX 7 for Java Server and Chart FX for Java 6.5. This program adds a new Ajax rendering engine that fully employs Ajax-technology to produce Chart images that allow full interactivity and support state in web applications.
Category: Web Authoring / JavaScript
Publisher: Software FX, Inc., License: Shareware, Price: USD $999.00, File Size: 141.9 MB
Platform: Windows
Running out of excuses for not keeping in touch with family and friends?
Running out of excuses for not keeping in touch with family and friends? With Pocket Phonetools staying in touch is simple. Pocket Phonetools transforms your Pocket PC or PDA into a complete communication device: Fax, SMS, Internet and more. Pocket Phonetools puts the ability to communicate at your fingertips. If you need a quick Internet connection at your...
Category: Internet / SMS
Publisher: BVRP Software, License: Shareware, Price: USD $49.90, File Size: 0
Platform: Windows,